Mastering Error Analysis in Scientific Quantities
160 likes | 306 Vues
Dive into the realm of uncertainty analysis in scientific quantities, covering precision, accuracy, random errors, and statistical treatments using probability functions and frequency distributions.

Mastering Error Analysis in Scientific Quantities
E N D
Presentation Transcript
Error Analysis(Analysis of Uncertainty) • Almost no scientific quantities are known exactly • there is almost always some degree of uncertainty in the value • Value ± Uncertainty • Values that are measured experimentally • Values that are calculated • from an equation • using other values which have their own uncertainty • A value might be determined both ways: calculate it and measure it
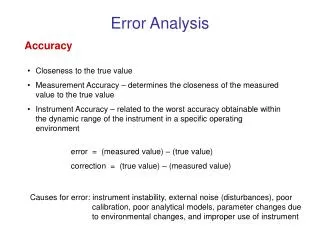
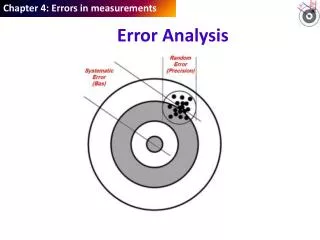
Uncertainty in Measured Values • Two components of Uncertainty • Measured value ± systematic errors ± random errors • Precision of a measurement (reproducibility) • variations due to random fluctuations • measure many times • power supply, angle of view of a meter, etc. • Accuracy of a measurement (total uncertainty) • includes uncertainty in precision • also includes systematic errors • incorrect experimental procedure, uncalibrated instrument, use a ruler with only 9 mm per cm, leakage of gas
Treatment of Random Errors • Assume that systematic errors have been eliminated • Simple Estimate • Analog Gauge or Scale • How finely divided is the readout, and how much more finely do you estimate that you can interpolate between those divisions? • Digital Readout • What is the smallest stable digit?
Statistical Treatment of Random Errors • Suppose you repeated the exact same measurement at the exact same conditions an infinite number of times • Not every measurement will be the same due to random errors • Instead there will be a distribution of measured values • Could use the results to construct a frequency distribution or probability function
Frequency Distribution orProbability Function • With a finite number of measurements you get a frequency distribution • Probability of a measurement falling within a given box is number in that box divided by total number • With an infinite number you get a probability function • Plot of P(x) versus x • P(x) is the probability of a measurement being between x and x + dx
Characteristics of the Probability Function • Certain kinds of experiments may naturally lead to a certain kind of probability function • For example, counting radioactive decay processes leads to a Poisson Distribution • Often, however, it is assumed that the errors are by a Normal Distribution Function • is the mean (average) of the infinite number of measurements • is the standard deviation of the infinite number of measurements
Use of the Probability Function • P(x-µ) is normalized: • That is, the total area under the P curve equals 1.0 • If you knew and (and so you knew P) you could find the limits between which 95% of all measurements lie. Insert plot with shaded area at left • Noting that P is symmetric about µ you could say with 95% confidence that the measured value lies between - and + • That is, the value is ± at the 95% confidence level
An Infinite Number of MeasurementsIsn’t Practical • You can only make a finite number of measurements • Therefore you do not know or • You can calculate the average and variance for your set of measurements
Average and Variance of the Data SetDo Not Equal and • Use Student’s t-Table to relate the two: • Pick a confidence level, 95% • Define degrees of freedom as N-1 • Read value of t • Be careful, t-Tables can be presented in two ways • One is such that 95% will be less than t • In this case if you want 95% between -t and t you need 97.5% less that t (the curves are symmetric) • Another is such that 95% will be between -t and t • Uncertainty limits are then found from the variance • value = average of the data set ±
One Form of Student’s t-Table Add shaded bell curve here • The value of t from this form of the table corresponds to 95% of all measurements being less than + and therefore 5% being greater than + • Note that if you want 95% of all measured values to fall between - and + • then 97.5% of all measured values must be less than + (or 2.5% will be greater than + ) • and then due to the symmetry of P 97.5% will also be greater than - (or another 2.5% will be less than - ) • so 95% will be between - and + Add abbreviated t-table here
Another Form of Student’s t-Table Add shaded bell curve here • The value of t from this form of the table corresponds to 95% of all measurements being between - and + • Therefore 5% are either • greater than + • or less than - Add abbreviated t-table here
Example • Add Problem Statement here • preferably use data from one of the experiments they are doing
Solution • Add solution here
Summary: Uncertainty in Measured Quantities • Measured values are not exact • Uncertainty must be estimated • simple method is based upon the size of the gauge’s gradations and your estimate of how much more you can reliably interpolate • statistical method uses several repeated measurements • calculate the average and the variance • choose a confidence level (95% recommended) • use t-table to find uncertainty limits • Next lecture • Uncertainty in calculated values • when you use a measured value in a calculation, how does the uncertainty propagate through the calculation • Uncertainty in values from graphs and tables