Error Analysis
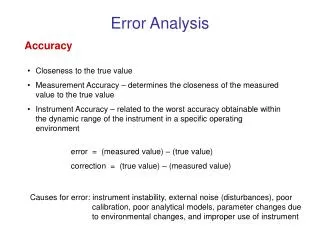
Error Analysis. Accuracy. Closeness to the true value Measurement Accuracy – determines the closeness of the measured value to the true value Instrument Accuracy – related to the worst accuracy obtainable within the dynamic range of the instrument in a specific operating environment.

Error Analysis
E N D
Presentation Transcript
Error Analysis Accuracy • Closeness to the true value • Measurement Accuracy – determines the closeness of the measured value to the true value • Instrument Accuracy – related to the worst accuracy obtainable within the dynamic range of the instrument in a specific operating environment error = (measured value) – (true value) correction = (true value) – (measured value) Causes for error: instrument instability, external noise (disturbances), poor calibration, poor analytical models, parameter changes due to environmental changes, and improper use of instrument
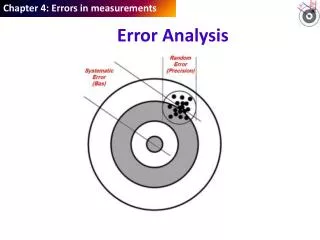
Errors can be classified as deterministic (systematic) and random (stochastic) • Deterministic errors are caused by well-defined factors such as • Nonlinearities • Offsets in readings • Can be accounted for by proper calibration and analysis practices – calibration charts and error ratings • Random errors are caused by uncertain factors such as • Noise • Unknown random variations in the operating environment • Statistical analysis using a sufficiently large number of data is necessary to estimate random errors
Precision Reproducibility (or repeatability) of an instrument reading determines the precision • Instrument error may be represented as a random variable with • Mean μe • Standard deviation σe X X X X X X X X o o o o o o o o If the standard deviation is zero the error is deterministic or repeatable Precision = (measurement range)/σe
Review of Probability and Statistics Cumulative Probability Density Function F(x) 1 Probability Density Function 0 X f(x) Area = 1 0 Mean Value X
Probability that a random variable falls within two values Mean Square Value Mean Value (Expected Value)
Variance and Standard Deviation f(x) 0 X
Some Properties If f(x) is pdf of Xthe mean and variance of aX + b aμ + b a2Var(X) Independent Random Variables Random variables X1 and X2 are said to be independent if the event X1 assumes a certain value is completely independent from the event X2 assumes a certain value. For independent Random variables X1 and X2
Sample Mean Sample Variance Unbiased Estimates
Example 2.6 An instrument has a response x that is random, with standard deviation σ. A set of N independent measurements {X1, X2,…….,XN} is made and the sample mean is computed. Show that the standard deviation of is Also, a measuring instrument produces a random error whose standard deviation is 1%. How many measurements should be averaged in order to reduce the standard deviation of error to less than 0.05%?
Gaussian (Normal) Distribution • Most extensively used probability distribution in engineering applications • Probability density function is given by Central Limit Theorem A random variable that is formed by summing a very large number of independent random variables takes Gaussian distribution in the limit. Standard Normal Distribution
Statistical Process Control (SPC) • Statistical analysis of process responses is used to generate control actions • Applications include manufacturing quality control, control of chemical process plants, enterprise resource planning systems, and urban transit control systems • Major step in SPC is to compute control limits (or action lines) on the basis of measured data from the process • Since high percentage of data is within ±3σ about the mean value, control limits or action lines are considered to be these boundaries Steps of SPC • Collect measurements of appropriate response variables of the process • Compute the mean and standard deviation of data and the upper and lower control limits • Plot the measured data and the two control limits • If measurements fall outside the control limits, take corrective action and repeat control cycle If the measurements are within the control limits, the process is in statistical control
Example 2.7 Error in a satellite tracking system was monitored on-line for a period of one hour to determine whether recalibration or gain adjustment of the tracking controller would be necessary. Four measurements of the tracking deviation were taken in a period of five minutes, and twelve such data groups were acquired during the one hour period. Sample means and sample variances of the twelve groups of data were computed. The results are tabulated as follows: Draw a control chart for the error process with control limits at . Establish whether the tracking controller is in statistical control or needs adjustment.
Confidence Intervals • The probability that the value of a random variable falls within a certain interval is called a confidence level • Consider a Gaussian random variable with mean μ and standard deviation σ • Suppose N measurements {X1, X2,……,XN} are made. The sample mean is an unbiased estimate for μ and the standard deviation of is . • Consider the normalized random variable • The probability that the values of Z falls within ±z0 is • For a given value of z0 this can be determined from the table or
Example 2.8 The angular resolution of a resolver (a rotary displacement sensor) was tested 16 times independently and recorded in degrees as follows: If the standard deviation of the angular resolution of this brand of resolvers is known to be 0.01o, what are the odds that the mean resolution would fall within 5% of the sample mean?
Error Combination • Error in a response variable would depend on errors present in measured variables and parameter values that are used to determine the unknown response variable. • For example, if the output power of a gas turbine is to be computed by measuring torque and speed at the output shaft, errors in two measured variable would directly contribute to the error in power computation. • In general if
Absolute Error This is an upper bound for the overall error SRSS Error – Square Root of Sum of Squares Error Since absolute error is a conservative upper bound an error that is used in practice is SRSS and is defined as
Example 2.10 Using the absolute value method for error combination, determine the fractional error in each item xi so that the contribution from each item to the overall error eABS is the same. This result is useful in the design of multicomponent systems and in the cost effective selection of instrumentation for a particular application.