Download
1 / 18
180 likes | 380 Vues
EC Tier 1 uncertainty analysis. Uncertainty workshop Bernd Gugele, ETC-ACC 5 September 2005. Availability of Table 6.1 of the Tier 1 uncertainty analysis as of 15 April 2005. For 13 MS Tier 1 uncertainty estimates available Four MS 2003, eight MS 2002, one MS 2001

E N D
EC Tier 1 uncertainty analysis Uncertainty workshop Bernd Gugele, ETC-ACC 5 September 2005
Availability of Table 6.1 of the Tier 1 uncertainty analysis as of 15 April 2005 For 13 MS Tier 1 uncertainty estimates available Four MS 2003, eight MS 2002, one MS 2001 Most MS cover all source categories (except for LUCF) 95 % of total EU-15 GHG emissions in 2003 are covered
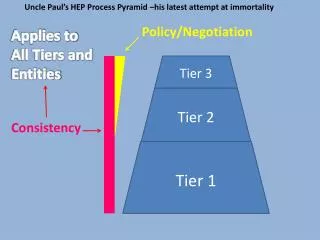
Uncertainty analysis: approach (1) • MS uncertainty estimates were grouped by source categories • Level of detail varies between MS • 1A (stationary), 1A1 or 1A1a • split by fuels or not • 2001/2002 used because more detailed fuel split
Uncertainty analysis: approach (3) • Then for each source category a range of uncertainty estimates was calculated: • lower bound: assuming no correlation among MS uncertainty estimates • upper bound: assuming full correlation among MS uncertainty estimates • Basic equations on summing up of variances with correlation: • VAR(X+Y)=VAR(X)+VAR(Y)+2COVAR(X,Y) • COVAR(X,Y)=r*sqrt[VAR(X)*VAR(Y)] • VAR: variance • COVAR: covariance • R: correlation coefficient (assumed to be 1)
Uncertainty analysis: approach (4) • Then single uncertainty estimate calculated for each source category assuming that: • MS uncertainty estimates fully correlate if default EF are used and/or Tier 1 methods are used • The fact that AD are most likely uncorrelated was neglected • Then uncertainty estimates for total GHG emissions and for the sectors were calculated: • Stationary fuel combustion • Transport • Fugitive emissions • Industrial processes • Agriculture • Waste Also plausibility checks were made with Monte Carlo tool
Uncertainty analysis: example CO2 emissions from 2 A 2 Lime Production MS uncertainties range from 5 % – 30 % Four MS use the same, default emission factors (DE, GR, SE, UK) Emissions of four member states are considered to be correlated, because they use the same, default EF Uncertainty EU-15 = 13.3 %
EU-15 uncertainty estimates • Lowest uncertainty estimates for stationary fuel combustion (1 %) and transport (3 %) • Highest estimates for agriculture (44 % - 83 %). • For agriculture the range depends on assumption on N2O emissions from soils: • lower bound: not correlated • upper bound: fully correlated
Uncertainty contribution 15 sources contribute 99.7% to EC uncertainties
Uncertainty estimates: 4D N2O EC range: 89% - 233%
Uncertainty estimates: 1A3b CO2 EC range: 3.4% - 7.4%; EC estimate: 3.4%
Uncertainty estimates: 4B N2O EC range: 50% - 133%; EC estimate: 109%
Uncertainty estimates: 4B CH4 EC range: 33% - 69%; EC estimate: 33%
Uncertainty estimates: 1A1a CO2 EC range: 3.1% - 5.0%; EC estimate: 3.1%
Issues for Working group • Level of detail of EC uncertainty analysis • Currently detailed level depending on MS availability • Combination of different levels (e.g. 1A1-1A1a; 1A) appropriate? • Methods/assumptions to combine uncertainty estimates at EC level • Criteria to identify correlations? • Currently: focus on EF and methods; neglect AD • Is assumption on full correlation appropriate? • Improvement of EC uncertainty analysis • Combination of various years: alternative? • Not for all MS/sectors (i.p. LULUCF) available: gap filling? • How to estimate trend uncertainty? No AD, EF uncertainty for EC • Correction for large uncertainties? Tier 2 approach? • Timing of EC uncertainty analysis • How often and when • Use of EC uncertainty estimates e.g. Tier 2 Key source analysis
Uncertainty 1A4b CO2 EC range: 3.2% - 7.0%; EC estimate: 3.3%