Estimating ABILITY with Confidence Intervals
Difference in Proportions. Estimating ABILITY with Confidence Intervals. Try this …. We’re trying out 4 different sugar cookie products. The following intervals are the result of a 95% confidence interval of likeability. Do the intervals provide convincing evidence ?

Estimating ABILITY with Confidence Intervals
E N D
Presentation Transcript
Difference in Proportions Estimating ABILITY with Confidence Intervals
Try this … We’re trying out 4 different sugar cookie products. The following intervals are the result of a 95% confidence interval of likeability. Do the intervals provide convincing evidence? Product A: 0.05 to 3.1 Product B: 0 to 4.2 Product C: -0.01 to 0.02 Product D: -2.3 to -2.0 Yes No No No
Hypothesis Test • H0: Hamilton has the sameABILITY to get a hit at home and on the road in the 2010 regular season. Ha: Hamilton has a greaterABILITY to get at home than on the road in the 2010 regular season. • Test statistic = BAhome - BAaway = 103/264 – 83/254 = 0.390 – 0.327 = 0.063 Hamilton’s batting average is estimated to be 0.063 greater at home than on the road.
Hypothesis Test: convincing evidence • Simulation gives a p-value of 0.15 There is a 15% chance that Hamilton’s difference in BA will be at least 0.063 by RANDOM CHANCE. • We do not have convincing evidence that Hamilton’s ABILITY to get a hit at home was better than on the road.
Hypothesis Test OR Confidence Interval
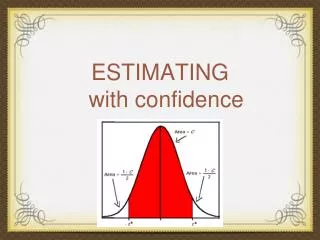
FORMULA Confidence Interval = center ± margin of error Where P = PERFORMANCE n = # of attempts
Application Remember, BAhome= 103/264=0.390 & BAaway=83/254=0.327 Confidence Interval Standard Deviation Margin of Error
Interpret We are 95% confident the interval of plausible values from -0.021 to 0.147 includes the difference in Hamilton’s ABILITY to get a hit at home and on the road.
If the interval of A – B has: • positive possibilities, then the athlete's ABILITY is better in context 1 than context 2. • a 0, then the athlete's ABILITY is the same in both contexts. • negativepossibilities, then the athlete's ABILITY is worse in context 1than context 2.
Conclusion (Hamilton’s difference in BA interval is from -0.021 to 0.147 ) We do not have convincing evidence that Hamilton’s ABILITY to get a hit at home was better than getting a hit on the road.
Sum It Up • If we want to estimate the difference in an athlete's ABILITY in two contexts, we can calculate a confidence interval for a difference in proportions (if the data are categorical). • We can decrease the margin of error in a CI by: • increasing the sample size • decreasing the number of standard deviations (AKA the multiplier)