Download
1 / 1
20 likes | 189 Vues
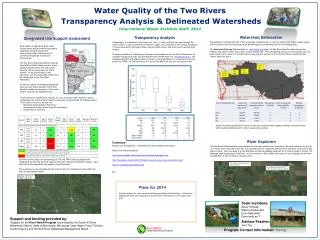
Water Quality of the Two Rivers Transparency Analysis & Delineated Watersheds International Water Institute Staff: 2014. Watershed Delineation

E N D
Water Quality of the Two Rivers Transparency Analysis & Delineated Watersheds International Water Institute Staff: 2014 Watershed Delineation The question of whether the size of the watershed contributing to a river at a given point affects water quality will be tested in the following exercise by delineating the contributing area of our sampling sites. The Watershed Planning Tool available at www.rrbdin.org/tools, the Red River Basin Decision Information website, was used to select pour points at each sample site. The contributing acreage for each sample site was determined and is shown in the table below along with the percent of the total Two Rivers watershed that “pours” past that point. Designated Use Support Assessment Transparency Analysis Transparency is a measure of the clarity of a river, i.e. how well light can pass through the water column. It can be affected by sediment, algae, color (bog stain), and various pollutants. It is also impacted by soil types, slope, riparian buffer zones, and storm events among other factors. To assess variability of transparency between sites sampled in the Two Rivers Watershed, all available transparency data was downloaded from the RW data site, riverwatch.wq.io/, and analyzed using box and whisker plots as shown in the graph below. For comparison, the pour point site, TWO1, for the Two Rivers as it enters the Red River was also included as well. River Watch is a Red River Basin-wide citizen water quality monitoring program organized and delivered by the International Water Institute and its partners through high schools and communities. The Two Rivers Watershed District has had several River Watch Teams conduct water quality measurements over many years however there are currently no active schools. In the past Kittson Co 4H, Lancaster, and Tri-County High School have all visited sites in the Two Rivers Watershed. All surface waters are assigned designated uses and have water quality criteria that identify conditions necessary for the water body to maintain its designated use. Transparency (cm) • The Two Rivers is classified as class 2B, for cool and warm water fisheries, and 2C, indigenous fish and associated aquatic community (not protected for drinking water) • The criteria that are to be met are: • Dissolved oxygen greater than 5mg/l • Transparency levels not less than 20 centimeters • pH between 6.5 and 8.5. Explain the above graph here in terms of how your assumed water quality rankings compared to the water quality ranking based on your transparency analysis. River Explorers The Two Rivers Watershed has many sections of river that would be fun to explore. The total distance of our trip is 15 miles, which will take a full day. Our starting point on County Road 58 looks to have great access and a safe place to park. Once we make it to the Red River we will be paddling upstream for 3 miles to make it to Hwy 175. Although paddling upstream is difficult, our involvement in River Watch has made us very intelligent so we know the Red River is one of flattest (slowest) rivers. Summary Explain your findings here, summarize the above boxplot information. Helpful links about boxplots: http://onlinestatbook.com/2/graphing_distributions/boxplots.html http://flowingdata.com/2008/02/15/how-to-read-and-use-a-box-and-whisker-plot/ http://en.wikipedia.org/wiki/Box_plot Etc. Plans for 2014 Put future plans for river watch monitoring and other activities here. Include one organization that you would like to present your information to in the upcoming year. The confluence of the Two Rivers with the Red River As shown in the table, the transparency at TO2 and TWO1 does not support the designated use and TO4 partially supports the state standards of Dissolve Oxygen. All of the sites in this watershed fully support the pH standard. The map below is showing the past ten years of data for transparency (the ability for light to pass through water). The confluence of North Branch of the Two Rivers with the mainstem Team members: Asher Kingster Wayne Goekenator Even Ashiamah Danni-with an “I” Advisor/Teacher: Yam Tirg Support and funding provided by: “Support for the River Watch Program is provided by the Sand Hill River Watershed District, State of Minnesota, Minnesota Clean Water Fund, Pollution Control Agency and the Red River Watershed Management Board.” Program Contact Information: The Fritz


![Strategic Analysis of India’s National River-Linking Project [NRLP]](https://cdn0.slideserve.com/691881/strategic-analysis-of-india-s-national-river-linking-project-nrlp-dt.jpg)