Download
1 / 21
210 likes | 239 Vues
This project focuses on developing techniques for modeling snowmelt processes using the Utah Energy Balance Model (UEB) and Geographic Information System (GIS). The study aims to calibrate and validate the distribution snowmelt model, reformulate the point energy and snowmelt model, and develop depletion curves to account for sub-grid variability. The methods developed will be implemented in the NOHRSC operational system.

E N D
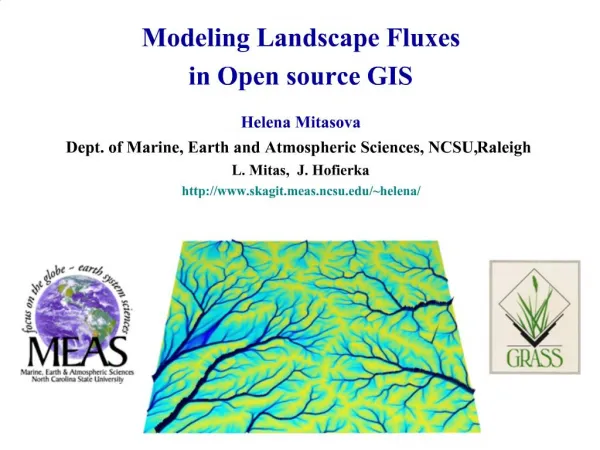
Snowmelt Modeling using UEB and GIS By You Jinsheng GIS in WATER RESOURCES
OBJECTIVE Develop techniques for the representation and parameterization of subgrid and distributed snow processes within snowmelt models. Collect data for Green Lake Valley Watershed in Colorado Snowmelt process and distribution modeling in UEB Model and SnowGRID model
PROJECTIVE OUTLINE Calibration and validation of the distribution snowmelt model in study watersheds Reformulation of the point energy and snowmelt model to account for sub-grid variability through use of depletion curves Development of depletion curves for area typical of broad scale elevation model elements, establish relationship between depletion curve and digital elevation data. Quantify scale dependence of depletion curves Relationship to topography and scale dependence together comprise the guidance to potential users on the development of depletion curves for practical application of this model. Transfer and implement the methods developed within NOHRSC operational System.
TODAY'S REPORT • Current status of the snow modeling project • Geographical data analysis in the watershed • Point snowmelt modeling • Grid snow modeling
ACKNOWLEDGEMENT • Dr. David Tarboton
INTRODUCE TO STUDY SITE The Green Lakes Valley (GLV) along the Colorado Front Range Comprises 8.1 km2, located approximately 35-km northwest of Boulder, CO. Elevation ranges from 3204 to 4087m, with most of the basin lying above treeline. The GLV study area flanks the eastern side of the Continental Divide and is part of the Niwot Ridge Long-Term Ecological Research (LTER) Project.
TOOLS GIS Software: Arcview 3.1 with spatial analysis extension, Sinmap, TardemProgramme Language: Visual C++, Visual FORTRAN,Visual BasicGraphical Tools: Splus 2000 Other tools:
PROJECT PROCEDURE • Data collect • Formation of Watershed and River Network • Implementation of UEB (Point Model) • Sub-grid Distributed Snowmelt Modeling
DEM of the study watershed The elevation in this watershed ranges from 3221 to 4087 meters with snow covered in the winter.
Delineate the river network and watershed • TarDEM • Using Dinf method (d8) contributing area
Green Lake Valley watershed by the Tardem Method: Sub watershed and river network
Study area data and point snow modeling sites Data for the modeling sub watershed. Four weather station is shown in the picture.
GridSnow Modeling Procedure DEM Weather Data Aspect GridSnow Slope SWE Map View Factor
FUTURE WORK Depletion Curves Method Scale Factor in the Snowmelt Modeling