Download
1 / 33
330 likes | 513 Vues
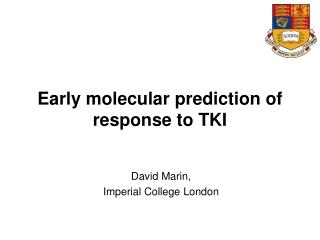
Early molecular prediction of response to TKI. David Marin, Imperial College London. I do not believe that we have been making the best of molecular monitoring.

E N D
Early molecular prediction of response to TKI David Marin, Imperial College London
I do not believe that we have been making the best of molecular monitoring. • Molecular monitoring is normally used to assess responses like MR3 and MR4.5 or CMR that are achieved late on therapy (while cytogenetics are used to assess responses early on therapy) • The current definitions of molecular response are partially arbitrary and with very little prognostic relevance
18 months 1.0 0.9 0.8 CCyR with no MMR, n=91 CCyR with MMR, n= 41 p= 0.4 0.7 0.6 Probability of PFS 0.5 0.4 0.3 0.2 0.1 0.0 0 6 12 18 24 30 36 42 48 54 60 Months from starting imatinib therapy PFS is similar in patients with CCyR regardless of the depth of molecular response Marin et al, Blood 2008
PFS similar in patients with CCyR regardless of depth of molecular response Druker BJ, et al. NEJM, 2006;355(25):2408-17.
PFS is similar in patients with CCyR regardless of depth of molecular response Kantarjian HM, et al. Blood. 2006;108:1835-1840.
Maybe we have the concept of MMR wrong? • The real question is: • What is the additional reduction in the transcript level that confers survival advantage in patients already in CCyR ?
Patient characteristics (n=282) Marin et al, JCO 2011
Outcome in 282 patients treated with imatinib first line in Hammersmith Hospital 94% 6% death non CML 10% death because the CML 84% 7% alive but not in CCyR 77% 29% in CCyR but not on imatinib 48% 48% in CCyR on imatinib Marin et al, JCO 2011
Using appropriate statistical methodology we can identify the cut off in the 12 month transcript level for patients in CCyR that predicts for OS with the maximal sensitivity and specify. BCR-ABL/ABL= 0.53% Marin et al, JCO 2011
166 out of 282 patients who received imatinib as first line therapy were in CCyR at 12 months Marin et al, JCO 2011
166 out of 282 patients who received imatinib as first line therapy were in CCyR at 12 months Marin et al, JCO 2011
Can we define robust molecular levels at 3, 6 or 12 month that have prognostic value?
Patients outcome according to the transcript level measured at 3 month Marin et al, JCO 2011
Survival for 282 patients treated with imatinib first line at the Hammersmith Hospital according to molecular response achieved at 3 months BCR-ABL/ABL<9.8% OS= 93.3% BCR-ABL/ABL>9.8% OS= 54% Probability of survival p<0.0001 Time from onset of imatinib therapy (years) Marin et al, JCO 2011
Cumulative incidence of CMR Time from onset of therapy (years) 8-year cumulative incidence of CMR on imatinib therapy according to the BCR-ABL transcript level at 3 months. 3-month transcript ratio ≤0.61% (n=57), 8-year CI of CMR of 84.7%, p<0.0001 3-month transcript ratio >0.61% (n=222), 8-years CI of CMR of 1.5% Marin et al, JCO 2011
Patient outcome according to BCR-ABL transcript level measured at 6 and 12 month Marin et al, JCO 2011
These cut-offs can be used in other centres when the transcript level is expressed on the international scale We have validated our findings using 95 patients treated with imatinib first line at the Royal Liverpool University Hospital Marin et al, JCO 2011
The predictive value of the transcript level measured at 3 months is not affected by imatinib dose reductions Marin et al, JCO 2011
Off Imatinib high transcript level at 3 month low transcript level at 3 month BCR-ABL1/ABL1 (log) CMR 3 months is the optimal time point to predict a patient’s outcome Marin et al, JCO 2011
Results of transcript levels at 3 and 6 months are generally consistent 66% (L/L) (85%) Yes 6 month (1.67%) 77% No Yes 11% (L/H) 3 month milestone 9.84% 2% (H/L) Yes No 6 month (1.67%) 23% No 21% (H/H) (91%)
(L/L) Low at 3 and low at 6 months (L/H) Low at 3 and high at 6 months (H/L) High at 3 and low at 6 months (H/H) High at 3 and high at 6 months 8 year CI of CCyR Low/Low (L/L) Low/ high (L/H) P<0.001 p<0.001 High/Low (H/L) P=0.09 High/High (H/H)
(L/L) Low at 3 and low at 6 months (L/H) Low at 3 and high at 6 months (H/L) High at 3 and low at 6 months (H/H) High at 3 and high at 6 months 8 year probability of OS 93.5 % (L/L) 92.4 % (L/H) 83.3 % (H/L) P<0.001 55.6 % (H/H)
The same principle applies to patients treated with 2G-TKI after imatinib failure
p=0.001 Probability of c-CCyRS Probability of OS p=0.02 Time (years) Time (years) OS and c-CCyRS in 107 patients treated with dasatinib or nilotinib after imatinib failure 3 months BCR-ABL/ABL <10%, n=77 3 months BCR-ABL/ABL >10%, n=30 Milojkovic et al, Blood 2012
SPIRIT 2: Study Design Arm A Imatinib400 R Chronic phase CML within 3 months of diagnosis Arm B Dasatinib100 Randomised open label study
Dasatinib patient characteristics Marin et al, Blood 2012
CCyR = 91.5% MR3 = 70.1% Cumulative incidence of response MR4.5 = 39.1% CMR = 6.5% Time from onset of therapy (months) 24 month cumulative incidences of cytogenetic and molecular responses Marin et al, Blood 2012
BCR-ABL/ABL ≤10%, n=117 p<0.001 BCR-ABL/ABL ≤10%, n=117 BCR-ABL/ABL >10%, n=11 Cumulative incidence of CCyR BCR-ABL/ABL >10%, n=11 p<0.001 Time from onset of therapy (months) Time from onset of therapy (months) The BCR-ABL1 transcript levels at 3 month strongly predict for the 2 year CI of CCyR, MR3 and, MR4.5 CCyR MR4.5 Cumulative incidence of MR4.5 Cumulative incidence of MR4.5 Marin et al, Blood 2012
….. but the optimal cut-offs may turn out to be lower MR4.5 CCyR BCR-ABL/ABL ≤2.26%, n=88 p<0.0001 BCR-ABL/ABL >2.26%, n=40 BCR-ABL/ABL ≤0.57%, n=62 Cumulative incidence of MR4.5 Cumulative incidence of CCyR BCR-ABL/ABL >0.57%, n=66 p<0.0001 Time from onset of therapy (months) Time from onset of therapy (months) Marin et al, Blood 2012
Thanks to: Dragana Milojkovic & John Goldman