Download
1 / 33
340 likes | 568 Vues
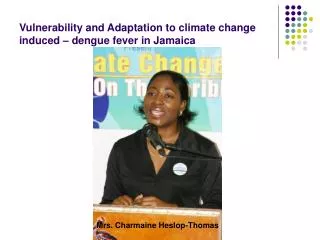
Vulnerability and Adaptation to climate change induced – dengue fever in Jamaica. Mrs. Charmaine Heslop-Thomas. VULNERABILITY TO DENGUE FEVER IN JAMAICA.

E N D
Vulnerability and Adaptation to climate change induced – dengue fever in Jamaica Mrs. Charmaine Heslop-Thomas
VULNERABILITY TO DENGUE FEVER IN JAMAICA Charmaine Heslop-Thomas, Wilma Bailey, Dharmaratne Amarakoon, Anthony Chen, Samuel Rawlins, David Chadee, Rainaldo Crossbourne, Albert Owino, Karen Polson, Cassandra Rhoden, Roxanne Stennett, Michael Taylor.
HISTORY • Virological evidence of the presence of dengue in the Caribbean in the 1950s. • The disease has been appearing with increasing frequency. • All four viruses are circulating. • The appearance of dengue 1 in Jamaica in 1977 resulted in 60,000 cases. • The last large epidemic appeared about 10 years ago.
RISK • Increase in temperature will shorten the incubation period of the virus. • The vector may become more infective more quickly. • Reproduce more rapidly. • Bite more frequently. • There may also be the increased risk of DHF.
EVIDENCE • A.aegypti is already appearing at higher elevations. • Simulations suggest a potential to spread into higher latitudes. • A link between El Nino and the incidence in some Pacific islands.
OBJECTIVES • To assess the vulnerability of the population of Jamaica to dengue. • To identify specific factors that put communities at risk.
BACKGROUND • A warming trend noted in the last two decades. • An upward (but not significant) trend in rainfall indices. • The increase particularly marked in El Nino and El Nino +1 years. • In the Caribbean the association of the disease with temperature is stronger and the lag with temperature is greater than that with rainfall
PROJECTIONS Projections for Jamaica for the years 2020, 2050, 2080 using statistical downscaling methods and two scenarios (SRES A2 AND B2) indicate the possibility of increased warming in the next century.
TO SUMMARISE • Changing climatic conditions may enhance dengue transmission. • Immunity is low. • But individual and contextual circumstances could modify vulnerability.
TWO LEVELS OF ANALYSISGeneric and Specific Adaptive Capacity • Macro level – current social and economic trends. Expert interviews in public sector organisations and NGOs. How do they interpret their roles? How prepared are they? • Local level study in communities that had experienced an outbreak. How vulnerable are they to an outbreak?
THE SURVEY • A 10 percent sample of household heads in: - Granville/Pitfour, a suburb of Montego Bay. - Retirement beyond the city’s boundaries. - John’s Hall, a rural community In addition, interviews were conducted with 14 experts.
THE MACRO LEVEL • The ending of the bauxite/alumina inspired boom in the 1970s. • IMF and its conditionalities. Their effect felt most keenly by the poor: -Job loss. -Devaluation and price increases. -Removal of subsidies on basic food items. • No real economic growth in more than 30 years.
POVERTY • Poverty peaked at 45 percent in 1991 and is fluctuating downwards. • Rural rates are persistently higher than urban. • Macro level downward trend not reflected in Kingston’s inner city. • Remittances are the most frequently mentioned source of income in the inner city.
THE INTERVIEWS A – THE MINISTRY OF HEALTH • Most saw the possibility of increasing transmission. • No long term strategies are in place. • A resource constraint necessitates prioritising: HIV/AIDS is the priority. • The cost of surveillance, and control, public education is too high. • Environmental sanitation is the responsibility of communities.
THE INTERVIEWS A - THE MINISTRY OF HEALTH (Continued) • The positives: • a well organised system of primary health care built on interlocking system of clinics. • a long tradition of involvement in policy oriented research eg. their involvement in the current climate change project. • A decentralised system of health care.
THE INTERVIEWS B. OTHER ORGANISATIONS • Office of Disaster Preparedness and Emergency Management; National Environment and Planning Agency; Water Resources Authority; National Meteorological Service. -Health was not a part of their mandate -Sea level rise posed a greater threat. The NGOs • Long term considerations such as climate change were not on their agenda.
THE COMMUNITIES • Granville/Pitfour, population of 6,300, a mix of formal and informal structures, 50% of respondents were living in informal structures. Heads self employed or in the service sector in Montego Bay. • Retirement, population of 1,783. Few informal dwellings. Heads in the service sector or public service in Montego Bay. • John’s Hall, population of 2,332. Rural squatters. Heads mainly female in domestic service and petty trading..
Vulnerability Indicators Based on indicators identified in the literature: • Immunity • Knowledge of symptoms and vectors of disease. • Use of protective measures. • Measures of resilience and stress – education, employment, income, female household headship, room densities, coping strategies, integration into the community. • Source of water, water storage. • Distance from the nearest health facility
Testing for vulnerability • Used the phi coefficient and chi –square to test if there was significant difference. a. household headship (Phi -0.6, p<.000). b. water storage in drums (Phi - 0.7, p<.000). c. knowledge of dengue transmission (Phi - 0.9, p<.000)
CONCLUSIONS 1 • Substantial number of people living in informal settlements is vulnerable. • Between 55,000 and 60,000 persons in Montego Bay (over 25 %) live in such settlements. • The poor are vulnerable and many of the poor work. • If communities must take responsibility for environmental sanitation they must be given the tools – education. • Access to water must be tackled on two fronts - the provision of low-cost, secure drums. -the granting of security of tenure to those who, because of their status, are denied access to running water.
CONCLUSIONS 2 • Public sector organisations must be persuaded that: -The threat of an outbreak of disease is not incompatible with a mandate to mitigate disaster or sustain development. -Healthy lifestyle is an outcome of sustainable development -They can incorporate disease control into their education programme.