Download
1 / 28
280 likes | 388 Vues
Estimating Tree Failure Risk Along Connecticut Utility Right-of-Ways. Helen Poulos Wesleyan University Ann Camp Yale School of Forestry and Environmental Studies. Research Problem.

E N D
Estimating Tree Failure Risk Along Connecticut Utility Right-of-Ways Helen Poulos Wesleyan University Ann Camp Yale School of Forestry and Environmental Studies
Research Problem • Vegetation management= critical component of right-of-way (ROW) maintenance for preventing electrical outages • Recent forest regeneration along ROW edges has increased the risk of transmission line failure due to tree contact with lines
While many trees along ROWs disable power, tree susceptibility to damage varies by • Species • Age • Rooting habit • Height to diameter relationships • Lean • Crown characteristics Identifying the role of these characteristics in determining a tree’s wind susceptibility is an important step toward mitigating the risk of transmission line failure from tree windthrow.
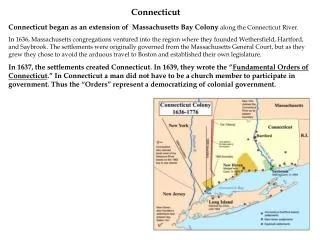
Environmental Influences on Hazard Tree Distributions • Topography • Land use history • Historical Storms • Soils • Substrate type Understanding the environmental conditions associated with ROW hazard trees could focus vegetation management efforts to locations with a greater potential for tree failure. Source: http://www.wesleyan.edu/ctgeology/CtLandscapes
Northeast Utilities needs a decision support system to differentiate hazard trees with a high probability of failure from the large number of danger treesthat could make contact with power lines
Research Questions • What is the density and distribution of hazard trees versus danger trees across 115 kV lines in Connecticut? • Which key tree attributes differentiate hazard trees (HTs) from danger trees (DTs)? • What environmental settings host HTs? • Can the HT-environment relationships be used to develop a HT distribution map for Connecticut to focus future management activities?
Field Methods • Systematically sampled 115 kV lines across Connecticut (N = 200) • Danger trees identified by triangulation • Recorded tree attributes • Species Substrate • Guild Rooting habit • Height Health • DBH Crown class • Live crown ratio • Height : diameter • Lean
Terminology • Live Crown Ratio • Crown Class • Height to Diameter Ratio
Environmental Variables GIS of 24 Raster Data Layers • Land cover • Storm probability • Distance to storm track • elevation (slope, aspect, etc.) • Topographic position • Flow accumulation • Wind speed -30 m, 50 m, 70 m, 100 m height • Topographic exposure • Wetness
Danger Tree Attributes (species, height, DBH, % live canopy, height : ratios, substrate, rooting habit, health, canopy position, guild) Cluster Analysis 2 Groups (Danger Tree / Hazard Tree) GIS Environmental Data CART Random Forest Classification Attributes of Hazard Trees Environmental Conditions for Hazard/ Hazard Trees Absent HT Maps for Connecticut
What is the density and distribution of hazard trees versus danger trees across 115 kV lines in Connecticut?
Which key tree attributes differentiate danger trees from hazard trees?
Hazard Trees = Tall, thin trees with live crown ratios greater than 0.65 and height: diameter ratios greater than 82.6
Trees with high live crown ratios have a high probability of falling because they had a larger area for wind resistance and/or ice or snow loading during winter storms (i.e. bigger ‘sails’) • Trees with high height: diameter ratios have an increased swaying frequency and decreased sway damping (i.e. ability of trees to absorb energy) when exposed to mechanical stress • Trees with a higher sway amplitude and lower damping capability are especially prone to breakage or uprooting.
What environmental settings host HTs? • Can the HT-environment relationships be used to develop a HT distribution map for Connecticut to focus future management activities?
Environmental Influences on HT Distributions Historical Storms Common • Historical storm tracks had the greatest influence on HT distributions • HTs were absent from locations with high numbers of historical storms • Frequent storms probably removed hazard trees • Young, short stature stands most likely dominate these locations • Trees may also be better wind adapted on these sites
Land Use Urban Areas • Land use was the second most important factor influencing HT distributions • Urban areas and waterways had few HTs • So while populated portions of the state are a source of public concern, it may be more important to concentrate management efforts on more heavily forested regions
Topography Upper Slopes and Ridgetops • HTs were absent from upper slopes and ridgetops • Upper topographic positions are more exposed which could remove trees in severe weather. • Harsher growing conditions and shallower soils on exposed ridgetops may have also hindered the development of tall, deep rooted tree cover.
Hazard Tree Distribution Map Total Map Error 24.6%
Conclusions Hazard trees with a high probability of failure were differentiated from danger trees by: • Live Crown Ratios • Tree Height • Height: Diameter Ratios
The key abiotic environmental influences on hazard tree distributions in Connecticut were: • Historical storm tracks • Land use • Topography • Topographic position (upper slopes and ridgetops) • Elevation
Management Applications • The classification tree has direct management applications for identifying hazard trees in the field. • It can be used with limited field equipment (i.e. a diameter tape and a laser range finder) to determine whether a potential risk tree poses a threat to power line transmission.
The hazard tree distribution map represents and additional level of decision support. • The hazard tree-environmental relationships can be used to understand the environmental settings influencing the presence or absence of hazard trees. • The map itself can be used to identify locations across Connecticut where hazard trees present a threat to power transmission safety.
Questions? Helen Poulos hpoulos@wesleyan.edu Poulos, H. M. and A. E. Camp. 2010. Decision Support for Mitigating the Risk of Tree Induced Transmission Line Failure in Utility Rights-of-Way. Environmental Management 45: 217-226. Poulos, H. M., and A. E. Camp. 2011. Mapping Threats to Power Line Corridors for Connecticut Rights-of-Way Management. Environmental Management 47: 230-238.