Impact of Diet on Body Weight Changes: Analysis of Successful vs. Unsuccessful Subjects
This study examines the weight variation during weight management (WM) and energy restriction (ER), categorizing participants based on their S-factor into successful (green circles) and unsuccessful (red circles) weight loss subjects. We employed both multivariate principal component analysis (PCA) and univariate 3-way ANOVA to explore differences in gene expression based on diet composition (LGI/LP, HGI/LP, LGI/HP, HGI/HP) and weight maintenance outcomes. Results indicate that the primary source of variation in gene expression is between successful and unsuccessful groups, revealing critical insights into dietary implications on weight management.

Impact of Diet on Body Weight Changes: Analysis of Successful vs. Unsuccessful Subjects
E N D
Presentation Transcript
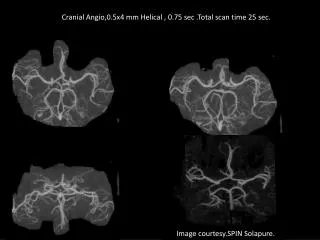
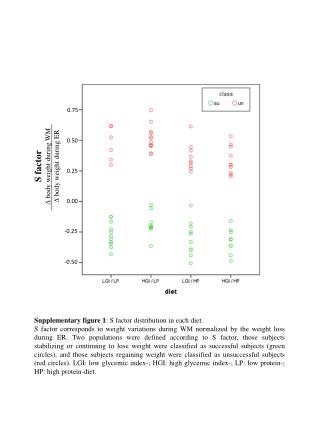
0.75 0.50 S factor D body weight during WM D body weight during ER 0.25 0.00 -0.25 -0.50 Supplementary figure 1: S factor distribution in each diet. S factor corresponds to weight variations during WM normalized by the weight loss during ER. Two populations were defined according to S factor, those subjects stabilizing or continuing to lose weight were classified as successful subjects (green circles), and those subjects regaining weight were classified as unsuccessful subjects (red circles). LGI: low glycemic index-; HGI: high glycemic index-; LP: low protein-; HP: high protein-diet.
7 6 5 3-way ANOVA 3-way ANCOVA 4 Mean F ratio 3 2 1 0 class diet energy subject error Factors A B Supplementary figure 2: Exploratory analyses Data was validated by both multivariate principal component analysis (PCA) and univariate 3-way ANOVA. A: multivariate principal component analysis first two compontents [t1] and [t2] explained the 12.5% and the the 10.7%. of the total variance, respectively. triangle. LGI/LP diet; box. HGI/LP diet; dot. LGI/HP diet; diamond. HGI/HP diet; in black. successful group; in grey. unsuccessful group B: univariate 3-way ANOVA with (ANCOVA) energy intake as cofactor. Both analysis show that the main source of variation in gene expression dataset was the difference between successful and unsuccessful groups (class).
Supplementary figure 3: Hierarchical clustering of genes differentiating between successful and unsuccessful groups independently of diet composition. These transcripts were significant to both multivariate analysis and ANCOVA analysis (VIP > 1, qValue < 0.05, respectively). Su: successful group; Un: unsuccessful group; LGI: low glycemic index-; HGI: high glycemic index-; LP: low protein-; HP: high protein-diet.
Supplementary figure 4: Networks associated with genes differentiating successful and unsuccessful groups as annotated by Ingenuity Pathways Analysis.

![Min. Values [ eVs ] Abucket / Abucket /4 h=1 …3.0 / 0.75 h=2 …1.1 / 0.27 h=3 …0.57 / 0.145](https://cdn2.slideserve.com/4121104/slide1-dt.jpg)