Download
1 / 3
30 likes | 105 Vues
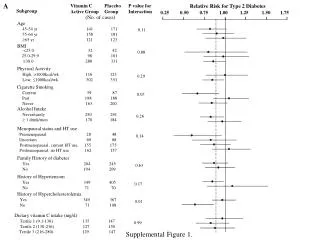
This study analyzes the correlation between dietary vitamin intake and the risk of Type 2 diabetes across different subgroups categorized by age, BMI, physical activity, smoking, alcohol consumption, menopausal status, family history of diabetes, hypertension, and hypercholesterolemia.

E N D
A Vitamin C Active Group Placebo Group P value for Interaction Relative Risk for Type 2 Diabetes Subgroup 0.25 0.50 0.75 1.00 1.25 1.50 1.75 (No. of cases) Age 45-54 yr 141 171 0.11 55-64 yr 158 181 65 yr 121 123 BMI <25.0 32 42 0.88 25.0-29.9 98 101 30.0 288 331 Physical Activity High, >1000kcal/wk 116 123 0.29 Low, 1000kcal/wk 302 351 Cigarette Smoking Current 59 87 0.05 Past 198 188 Never 163 200 Alcohol Intake Never/rarely 250 291 0.26 1 drink/mon 170 184 Menopausal status and HT use Premenopausal 28 48 0.14 Uncertain 69 88 Postmenopausal, current HT use 155 175 Postmenopausal, no HT use 162 157 Family History of diabetes Yes 204 245 0.63 No 194 209 History of Hypertension Yes 349 405 0.17 No 71 70 History of Hypercholesterolemia Yes 349 367 0.01 No 71 108 Dietary vitamin C intake (mg/d) Tertile 1 (9.1-130) 135 147 0.99 Tertile 2 (130-216) 127 150 Tertile 3 (216-280) 129 147 Supplemental Figure 1.
B Vitamin E Active Group Placebo Group P value for Interaction Relative Risk for Type 2 Diabetes Subgroup 0.50 1.00 1.50 2.00 2.50 (No. of cases) Age 45-54 yr 159 153 0.30 55-64 yr 178 161 65 yr 137 107 BMI <25.0 44 30 0.37 25.0-29.9 103 96 30.0 326 293 Physical Activity High, >1000kcal/wk 121 118 0.40 Low, 1000kcal/wk 352 301 Cigarette Smoking Current 178 168 0.57 Past 199 187 Never 197 166 Alcohol Intake Never/rarely 279 262 0.57 1 drink/mon 195 159 Menopausal status and HT use Premenopausal 36 40 0.27 Uncertain 80 77 Postmenopausal, current HT use 173 157 Postmenopausal, no HT use 179 140 Family History of diabetes Yes 240 209 0.30 No 212 191 History of Hypertension Yes 394 360 0.58 No 80 61 History of Hypercholesterolemia Yes 377 339 0.61 No 97 82 Dietary vitamin E intake (IU/d) Tertile 1 (1.82-9.75) 151 121 0.21 Tertile 2 (9.76-43.7) 153 147 Tertile 3 (43.8-899) 132 131 Supplemental Figure 1.
C -Carotene Active Group Placebo Group P value for Interaction Relative Risk for Type 2 Diabetes Subgroup 0.50 1.00 1.50 2.00 2.50 (No. of cases) Age 45-54 yr 159 153 0.30 55-64 yr 178 161 65 yr 137 107 BMI <25.0 44 30 0.37 25.0-29.9 103 96 30.0 326 293 Physical Activity High, >1000kcal/wk 121 118 0.40 Low, 1000kcal/wk 352 301 Cigarette Smoking Current 178 168 0.57 Past 199 187 Never 197 166 Alcohol Intake Never/rarely 279 262 0.57 1 drink/mon 195 159 Menopausal status and HT use Premenopausal 36 40 0.27 Uncertain 80 77 Postmenopausal, current HT use 173 157 Postmenopausal, no HT use 179 140 Family History of diabetes Yes 240 209 0.30 No 212 191 History of Hypertension Yes 394 360 0.58 No 80 61 History of Hypercholesterolemia Yes 377 339 0.61 No 97 82 Dietary total carotene intake (mg/d) Tertile 1 (1.82-9.75) 151 121 0.21 Tertile 2 (9.76-43.7) 153 147 Tertile 3 (43.8-899) 132 131 Supplemental Figure 1.