Download
1 / 35
380 likes | 1.44k Vues
Basics of Sequence Alignment and Weight Matrices and DOT Plot. G P S Raghava Email: raghava@imtech.res.in Web: http://imtech.res.in/raghava/. Importance of Sequence Comparison. Protein Structure Prediction Similar sequence have similar structure & function Phylogenetic Tree

E N D
Basics of Sequence Alignment and Weight Matrices and DOT Plot G P S Raghava Email: raghava@imtech.res.in Web: http://imtech.res.in/raghava/
Importance of Sequence Comparison • Protein Structure Prediction • Similar sequence have similar structure & function • Phylogenetic Tree • Homology based protein structure prediction • Genome Annotation • Homology based gene prediction • Function assignment & evolutionary studies • Searching drug targets • Searching sequence present or absent across genomes
Protein Sequence Alignment and Database Searching Alignment of Two Sequences (Pair-wise Alignment) The Scoring Schemes or Weight Matrices Techniques of Alignments DOTPLOT Multiple Sequence Alignment (Alignment of > 2 Sequences) Extending Dynamic Programming to more sequences Progressive Alignment (Tree or Hierarchical Methods) Iterative Techniques Stochastic Algorithms (SA, GA, HMM) Non Stochastic Algorithms Database Scanning FASTA, BLAST, PSIBLAST, ISS Alignment of Whole Genomes MUMmer (Maximal Unique Match)
Pair-Wise Sequence Alignment Scoring Schemes or Weight Matrices Identity Scoring Genetic Code Scoring Chemical Similarity Scoring Observed Substitution or PAM Matrices PEP91: An Update Dayhoff Matrix BLOSUM: Matrix Derived from Ungapped Alignment Matrices Derived from Structure Techniques of Alignment Simple Alignment, Alignment with Gaps Application of DOTPLOT (Repeats, Inverse Repeats, Alignment) Dynamic Programming (DP) for Global Alignment Local Alignment (Smith-Waterman algorithm) Important Terms Gap Penalty (Opening, Extended) PID, Similarity/Dissimilarity Score Significance Score (e.g. Z & E )
Why sequence alignment • Lots of sequences with unknown structure and function vs. a few (but growing number) sequences with known structure and function • If they align, they are „similar“ • If they are similar, then they might have similar structure and/or function. Identify conserved patterns (motifs) • If one of them has known structure/function, then alignment of other might yield insight about how the structure/functions works. Similar motif content might hint to similar function • Define evolutionary relationships
Basics in sequence comparison Identity The extent to which two (nucleotide or amino acid) sequences are invariant (identical). Similarity The extent to which (nucleotide or amino acid) sequences are related. The extent of similarity between two sequences can be based on percent sequence identity and/or conservation. In BLAST similarity refers to a positive matrix score. This is quite flexible (see later examples of DNA polymerases) – similar across the whole sequence or similarity restricted to domains ! Homology Similarity attributed to descent from a common ancestor.
The Scoring Schemes or Weight Matrices For any alignment one need scoring scheme and weight matrix Important Point All algorithms to compare protein sequences rely on some scheme to score the equivalencing of each 210 possible pairs. 190 different pairs + 20 identical pairs Higher scores for identical/similar amino acids (e.g. A,A or I, L) Lower scores to different character (e.g. I, D) Identity Scoring Simplest Scoring scheme Score 1 for Identical pairs Score 0 for Non-Identical pairs Unable to detect similarity Percent Identity
DNA scoring systems Sequence 1 ACTACCAGTTCATTTGATACTTCTCAAA | | | || Sequence 2 TACCATTACCGTGTTAACTGAAAGGACTTAAAGACT A C G T A 1 0 0 0 C 0 1 0 0 G 0 0 1 0 T 0 0 0 1 Match: 5 x 1 = 5 Mismatch: 19 x 0 = 0 Score: 5
The Scoring Schemes or Weight Matrices Genetic Code Scoring Fitch 1966 based on Nucleotide Base change required (0,1,2,3) Required to interconvert the codons for the two amino acids Rarely used nowadays
Complication: „inexact“ is not binary (1|0) but something relative Amino acids have different physical and biochemical properties that are/are not important for function and thus influence their probability to be replaced in evolution
The Scoring Schemes or Weight Matrices Chemical Similarity Scoring Similarity based on Physio-chemical properties MacLachlan 1972, Based on size, shape, charge and polar Score 0 for opposite (e.g. E & F) and 6 for identical character
The Scoring Schemes or Weight Matrices Observed Substitutions or PAM matrices Based on Observed Substitutions Chicken and Egg problem Dayhoff group in 1977 align sequence manually Observed Substitutions or point mutation frequency MATRICES are PAM30, PAM250, PAM100 etc AILDCTGRTG…… ALLDCTGR--…… SLIDCSAR-G…… AILNCTL-RG……
PAM (Percent Accepted Mutations) matrices • Derived from global alignments of protein families.Family members sharing at least 85% identity (Dayhoff et al., 1978). • Construction of phylogenetic tree and ancestral sequences of each protein family • Computation of number of substitutions for each pair of amino acids
How are substitution matrices generated ? • Manually align protein structures (or, more risky, sequences) • Look for frequency of amino acid substitutions at structurally constant sites. • Entry -log(freq(observed/freq(expected)) + → more likely than random 0 → At random base rate - → less likely than random
The Math • Score matrix entry for time t given by: s(a,b|t) = log P(b|a,t) qb Conditional probability that a is substituted by b in time t Frequency of amino acid b
PAM Matrices: salient points • Derived from global alignments of closely related sequences. • Matrices for greater evolutionary distances are extrapolated from those for lesser ones. • The number with the matrix (PAM40, PAM100) refers to the evolutionary distance; greater numbers are greater distances. • Does not take into account different evolutionary rates between conserved and non-conserved regions.
The Scoring Schemes or Weight Matrices BLOSUM- Matrix derived from Ungapped Alignment Similar idea to PAM matrices Derived from Local Alignment instead of Global Blocks represent structurally conserved regions Henikoff and Henikoff derived matric from conserved blocks BLOSUM80, BLOSUM62, BLOSUM35
BLOSUM (Blocks Substitution Matrix) • Derived from alignments of domains of distantly related proteins (Henikoff & Henikoff, 1992) A A C E C • Occurrences of each amino acid pair in each column of each block alignment is counted • The numbers derived from all blocks were used to compute the BLOSUM matrices A A C E C A - A = 1 A - C = 4 A - E = 2 C - E = 2 C - C = 1
BLOSUM (Blocks Substitution Matrix) • Sequences within blocks are clustered according to their level of identity • Clusters are counted as a single sequence • Different BLOSUM matrices differ in the percentage of sequence identity used in clustering • The number in the matrix name (e.g. 62 in BLOSUM62) refers to the percentage of sequence identity used to build the matrix • Greater numbers mean smaller evolutionary distance
BLOSUM Matrices: Salient points • Derived from local, ungapped alignments of distantly related sequences • All matrices are directly calculated; no extrapolations are used – no explicit model • The number after the matrix (BLOSUM62) refers to the minimum percent identity of the blocks used to construct the matrix; greater numbers are lesser distances. • The BLOSUM series of matrices generally perform better than PAM matrices for local similarity searches (Proteins 17:49).
Sequence 1 Sequence 2 PTHPLASKTQILPEDLASEDLTI |||||| | || || PTHPLAGERAIGLARLAEEDFGM Protein scoring systems substitution matrix C S T P A G N D . . C 9 S -1 4 T -1 1 5 P -3 -1 -1 7 A 0 1 0 -1 4 G -3 0 -2 -2 0 6 N -3 1 0 -2 -2 0 5 D -3 0 -1 -1 -2 -1 1 6 . . T:G = -2 T:T = 5 ... Score = 48
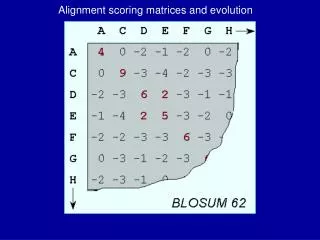
displaying the score matrix blosum62... A R N D C Q E G H I L K M F P S T W Y V B Z X A 4 R -1 5 N -2 0 6 D -2 -2 1 6 C 0 -3 -3 -3 9 Q -1 1 0 0 -3 5 E -1 0 0 2 -4 2 5 G 0 -2 0 -1 -3 -2 -2 6 H -2 0 1 -1 -3 0 0 -2 8 I -1 -3 -3 -3 -1 -3 -3 -4 -3 4 L -1 -2 -3 -4 -1 -2 -3 -4 -3 2 4 K -1 2 0 -1 -3 1 1 -2 -1 -3 -2 5 M -1 -1 -2 -3 -1 0 -2 -3 -2 1 2 -1 5 F -2 -3 -3 -3 -2 -3 -3 -3 -1 0 0 -3 0 6 P -1 -2 -2 -1 -3 -1 -1 -2 -2 -3 -3 -1 -2 -4 7 S 1 -1 1 0 -1 0 0 0 -1 -2 -2 0 -1 -2 -1 4 T 0 -1 0 -1 -1 -1 -1 -2 -2 -1 -1 -1 -1 -2 -1 1 5 W -3 -3 -4 -4 -2 -2 -3 -2 -2 -3 -2 -3 -1 1 -4 -3 -2 11 Y -2 -2 -2 -3 -2 -1 -2 -3 2 -1 -1 -2 -1 3 -3 -2 -2 2 7 V 0 -3 -3 -3 -1 -2 -2 -3 -3 3 1 -2 1 -1 -2 -2 0 -3 -1 4 B -2 -1 3 4 -3 0 1 -1 0 -3 -4 0 -3 -3 -2 0 -1 -4 -3 -3 4 Z -1 0 0 1 -3 3 4 -2 0 -3 -3 1 -1 -3 -1 0 -1 -3 -2 -2 1 4 X 0 -1 -1 -1 -2 -1 -1 -1 -1 -1 -1 -1 -1 -1 -2 0 0 -2 -1 -1 -1 -1 -1 di-sulphide bridges – important for protein structure often in reactive center Helix breaker – secondary structure Both substrates for S/T kinases bulky aromatic substitution (scoring) matrix Grouping of side chains by charge, polarity ... Exchange of D (Asp) by E (Glu) is „better“ (both are negatively charged) than replacement e.g. by F (Phe) (aromatic) C (Cys) makes disulphide bridges and cannot be exchanged by other residue → high score of 9.
Different substitution matrices for different alignments more stringent less stringent • BLOSUM matrices usually perform better than PAM matrices for local similarity searches (Henikoff & Henikoff, 1993) • When comparing closely related proteins one should use lower PAM or higher BLOSUM matrices, for distantly related proteins higher PAM or lower BLOSUM matrices • For database searching the commonly used matrix (default) is BLOSUM62
The Scoring Schemes or Weight Matrices PET91: An Updated PAM matrix Matrices Derived from Structure Structure alignment is true/reference alignment Allow to compare distant proteins Risler 1988, derived from 32 protein structures Which Matrix one should use Matrices derived from Observed substitutions are better BLOSUM and Dayhoff (PAM) BLOSUM62 or PAM250
Dealing Gaps in Pair-wise Alignment Sequence Comparison without Gaps Slide Windos method to got maximum score ALGAWDE ALATWDE Total score= 1+1+0+0+1+1+1=5 ; (PID) = (5*100)/7 Sequence with variable length should use dynamic programming Sequence Comparison with Gaps Insertion and deletion is common Slide Window method fails Generate all possible alignment 100 residue alignment require > 1075 Alignment of Two Sequences
Alternate Dot Matrix PlotDiagnoal * shows align/identical regions
The dotplot generates a diagonal But there are more matches which are either meaningful, or noise Dotplot Dotplot gives an overview of all possible alignments The ideal case: two identical sequences Sequence 1 T A T C G A A G T A T A T C G A A G T A Every word in one sequence is aligned with each word in the second sequence Sequence 2
Dotplot Dotplot gives an overview of all possible alignments The normal case: two somewhat similar sequences Sequence 1 T A T C G A A G T A T A T T C A T G T A isolated dots 2 dots form a diagonal Sequence 2 3 dots form a diagonal
Dotplot Dotplot gives an overview of all possible alignments Filters (word size) can be introduced to get rid of noise Sequence 1 Word size = 1 T A T C G A A G T A T A T T C A T G T A isolated dots 2 dots form a diagonal Sequence 2 3 dots form a diagonal
Dotplot Dotplot gives an overview of all possible alignments Filters (word size) can be introduced to get rid of noise Sequence 1 Word size = 2 T A T C G A A G T A T A T T C A T G T A 2 dots form a diagonal Sequence 2 3 dots form a diagonal
Dotplot Dotplot gives an overview of all possible alignments Filters (word size) can be introduced to get rid of noise Sequence 1 Word size = 3 T A T C G A A G T A T A T T C A T G T A Sequence 2 3 dots form a diagonal
Dotplot Dotplot gives an overview of all possible alignments Filters (word size) can be introduced to get rid of noise Sequence 1 Word size = 4 T A T C G A A G T A T A T T C A T G T A Sequence 2 conditions too stringent !!
Dot matrixexample of a repetitive DNA sequence • In addition to the main diagonal, there are several other diagonalsOnly one half of the matrix is shown because of the symmetry perfect tool to visualize repeats
Problems with Dot matrices • Rely on visual analysis (necessarily merely a screen dump due to number of operations) Improvement: Dotter (Sonnhammer et al.) • Difficult to find optimal alignments • Difficult to estimate significance of alignments • Insensitive to conserved substitutions (e.g. L ↔ I or S ↔T) if no substitution matrix can be applied • Compares only two sequences (vs. multiple alignment) • Time consuming (1,000 bp vs. 1,000 bp = 106 operations, 1,000,000 vs. 1,000,000 bp = 1012 operations)