Download
1 / 29
290 likes | 445 Vues
Tiffany C. Vance (NOAA/NMFS Alaska Fisheries Science Center) Christopher W. Moore (University of Washington, NOAA OAR/PMEL) Nazila Merati ( University of Washington, NOAA OAR/PMEL). Integration of Java and GIS for visualization and analysis of marine data. Introduction.

E N D
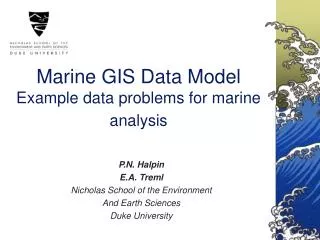
Tiffany C. Vance (NOAA/NMFS Alaska Fisheries Science Center) Christopher W. Moore (University of Washington, NOAA OAR/PMEL) Nazila Merati ( University of Washington, NOAA OAR/PMEL) Integration of Java and GIS for visualization and analysis of marine data
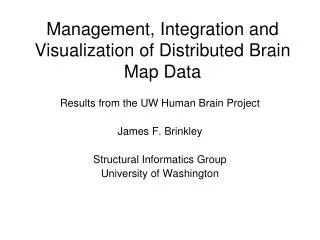
Introduction Traditional geographic information systems provide spatial analysis tools, but the analyses are usually limited to 2.5 dimensions. New software tools are making it possible to integrate GIS with Java tools to provide a prototype of a ‘scientific GIS’ that can allow truly three-dimensional analyses.
Pragmatic question - potential users • Oceanographers who are familiar with scientific analytical tools – MATLAB etc. • Fisheries biologists who are familiar with GIS – especially ESRI products • Creating a common tool?
Programming options • ArcObjects/Visual Basic - limited to single platform, limitations of VB • Java with ArcGIS Engine - platform independent, cost • Open source GIS tools such as GRASS, MapServer, PostGIS, GeoTools and VisAD - documentation/support • Java as link for existing tools
ArcGIS Engine developer kit • Several application program interfaces (COM, Java, .NET, and C++) • Cost-effective deployment requiring only an ArcGIS Engine Runtime or ArcGIS Desktop license per computer • Developer controls available in ActiveX, .NET, and Java that simplify application development
Switch from 2D projections to 3D Read simple shape files Rotate/pan/zoom Hyperlink objects and 3D “picking” OceanGIS prototype
Application diagram • Graphical objects (Gob) are created for various functions • The GobListManager keeps track of objects • Each Gob has specific functionality and tools
Graphical objects for tools Data objects and tools are encapsulated, allowing a Graphical Object Manager API style Graphical Objects, with associated tools and meta-data
Test Case - mixed layer depth (MLD) The depth to which water is well mixed. This has ramifications for fish and planktonic organisms, also for nutrients. Surface layer sits above the thermocline. Defined as the layer where the temperature is within 0.5° of the average surface temperature or where the potential density is within 0.125 of the surface average www.fd.ntou.edu.tw/5CTemperature201025.doc
Java implementation • MLD algorithm from VB to Java • GeoTools toolkit shapefile reader (Java) used to read shapefile • Created a new application in Java to calculate the MLD and output a VTK OpenGL window • VTK wrapped in Java • Can also display MLD shapefile created in ArcGIS version
Dapper data access Accessing ocean profile sensor data from database (selected profiles in blue)
Ocean analysis algorithms • UNESCO routines for water properties • Oceanographic Analyst (ArcView 3.2) http://www.absc.usgs.gov/glba/gistools/ • MATLAB tools - SEA-MAT package http://woodshole.er.usgs.gov/operations/sea-mat/ • VTK toolkit - for volume analysis http://public.kitware.com/VTK/
CTD cast location (light blue) Mixed-layer depth (dark blue)
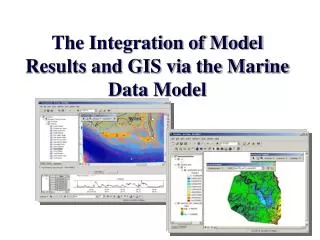
Resulting ocean profile sections analyzed with GIS statistical analysis tools
Initial integration with ArcGIS: The Java API allows re-use of code. Our oceanographic tools are embedded in a graphical object data model. ArcGIS Engine will allow us to embed ESRI statistical analysis tools (or any ArcObject tool) as well
Example one: Marine mammal path through isosurface • VTK functions to calculate intersection of line and surface • Above/below the surface • Generalize to inside/outside a volume
Example two: Hydrothermal plume model output VTK/Java3D allows volume calculations, rendering, and analysis. • 3D probe • animation • bathymetry • multibeam • Smith/Sandwell
Example three: Global gridded data Reynolds SST anomaly January 1989 (overlayed with etopo05)
Example four: Tsunami visualizations ported from the ImmersaDesk:
Integrating 3D visualization and GIS • Parallel-platform rendering • Oceanographic in-situ data importing • Immersive environments • Viz cluster/composite rendering
Future work • Use of ArcGIS Engine to allow traditional GIS analysis • Integration of more GIS-based analytical tools • Implementation of more VTK-based 3D analyses • Integration with simulation models to allow model driving via a visual interface • Linking with models as a graphical front end
Credits and Contacts • The NOAA HPCC program for funding • Christopher.Moore@noaa.gov • Nazila.Merati@noaa.gov • Tiffany.C.Vance@noaa.gov For more details: www.pmel.noaa.gov/vrl/OceanGIS
Ocean Analysis Algorithms • UNESCO routines for water properties • Oceanographic Analyst (ArcView 3.2) http://www.absc.usgs.gov/glba/gistools/ • Matlab tools - SEA-MAT package http://woodshole.er.usgs.gov/operations/sea-mat/ • USGS sedx package http://woodshole.er.usgs.gov/staffpages/csherwood/sedx_equations/sedxinfo.html • VTK toolkit - for volume analysis http://public.kitware.com/VTK/