References:
Neural correlates of social coordination:. Spatiotemporal analysis of brain and behavior. Armin Fuchs*, Emmanuelle Tognoli, Daniela Benites, J.A. Scott Kelso. Center for Complex Systems and Brain Sciences. 239.17. Florida Atlantic University, Boca Raton, FL 33431. Segmentation Procedure.

References:
E N D
Presentation Transcript
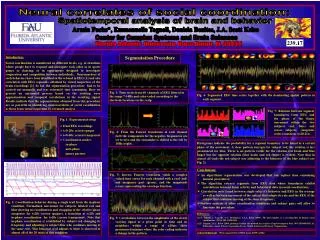
Neural correlates of social coordination: Spatiotemporal analysis of brain and behavior Armin Fuchs*, Emmanuelle Tognoli, Daniela Benites, J.A. Scott Kelso Center for Complex Systems and Brain Sciences 239.17 Florida Atlantic University, Boca Raton, FL 33431 Segmentation Procedure Introduction: Social coordination is manifested on different levels, e.g. in situations where people have to respond and anticipate each other as in sports games or dancing, or in experiments designed to investigate cooperation and competition between individuals. Neuromarkers of such behaviors have been identified in the α-band in EEG [1] and also correlated with EEG segments obtained by visual inspection of the brain recordings [2]. So far, the segmentation procedure had to be carried out manually and was extremely time consuming. Here we present an automated process based on the rotating wave approximation and temporal correlations in the resulting signal. Results indicate that the segmentations obtained from this procedure are as powerful in identifying neurocorrelates of social coordination as those form visual inspection by a trained analyst. Fig. 3: Time series from 60 channels of EEG filtered in the range 7-14Hz and color-coded according to the electrode locations on the scalp. Fig. 6: Segmented EEG time series together with the dominating spatial pattern in each segment. Fig. 7: Relation between segment boundaries from EEG and the phase of the finger movement within the two subjects (red, blue) and across subjects (magenta) at the transition (t=20-21s). • Fig. 1: Experimental setup • Dual EEG recordings • t=0-20s: screen opaque • t=0-40s: screen transparent • Coordination modes: • in-phase • anti-phase • ignore partner Histograms indicate the probability for a segment boundary to be found at a certain phase of the movement. A clear pattern emerges for subject red; the relation is less pronounced for blue. There is no pattern visible for the relation red brain and blue finger but the opposite relation (blue brain and red finger) is evident. Note that in almost all trails the red subject was adjusting to the behavior of the blue subject (see Fig. 2). Fig. 4: From the Fourier transforms of each channel (left) the components for the negative frequencies are set to zero and the remainder is shifted to the left by 10Hz (right). • Conclusions: • An algorithmic segmentation was developed that can replace time consuming manual procedures; • The algorithm extracts segments from EEG data whose boundaries exhibit correlations between brain activity and behavioral data in social coordination; • Correlation were found between single subject’s behavior and EEG in the α-range as well as between movement of the subject that adapts its rate and the EEG of the subject that continues moving at the same frequency; • Further analysis of other coordination conditions and subject pairs will allow to fine-tune the procedure. Fig. 5: Inverse Fourier transform yields a complex valued time series for each channel with a real (red) and imaginary part (green), and the magnitude (cyan) representing the envelope function. Fig. 2: Coordination behavior during a single trail from the in-phase condition. Normalized movement for subjects labeled red and blue showing no coordination and wrapping of the relative phase (magenta) for t<20s (screen opaque), a transition at t=20s and in-phase coordination for t>20s (screen transparent). Note that in-phase coordination is established by subject red changing its frequency and adjusting to subject blue who continues moving at the same rate. This behavior (red adjusts to blue) is observed in almost all of the 20 trials of this condition. References: [1] E. Tognoli, J. Lagarde, G.C. DeGuzman, J.A.S. Kelso (2006). The phi complex as a neuromarker of human social coordination. PNAS 104: 8190-8195 [2] E. Tognoli, J.A.S. Kelso (2009, pending) System and method for analysis of spatio-temporal data. WO 2010/016992 A2. Publication under Patent Cooperation Treaty. World Intellectual Property Organization. Fig. 5: Correlations between the amplitudes of the slowly varying signal at a given point in time and its neighbors within a range of ±10ms show pronounced minima where the color coding indicates a change in the pattern. Acknowledgement: Work supported by NINDS grant 48299 (JASK).