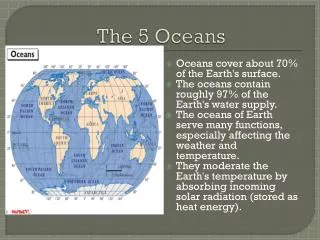
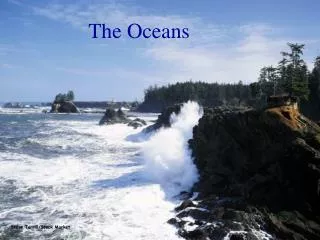
The Oceans
The Oceans. Steve Terrill/Stock Market. Sandy Beach, North Carolina Barrier Island. Fig. 17.1. Peter Kresan. Boulder Beach, Massachusetts. Fig. 17.2. Raymond Siever. Wave height depends on:. Wind velocity Wind duration Distance over which wind blows. Wave-generated Orbital Waves.

The Oceans
E N D
Presentation Transcript
The Oceans Steve Terrill/Stock Market
Sandy Beach, North Carolina Barrier Island Fig. 17.1 Peter Kresan
Boulder Beach, Massachusetts Fig. 17.2 Raymond Siever
Wave height depends on: • Wind velocity • Wind duration • Distance over which wind blows
Wave-generated Orbital Waves Fig. 17.3
Wave characteristics • Length (L): distance between crests • Height (H) : vertical distance between crest and trough • Period (T): time for successive waves to pass a fixed point
Velocity (V) of waves V = L/T
Waves in shallow water • Wave height increases • Wave length decreases • Velocity decreases • Period doesn’t change
Surf Zone Zone between where the waves break to point furthest up the shore where the waves wash up
Wave refraction • Bending of wave crests as they approach the beach at a non-normal angle • Caused by the change in velocity of waves as a function of water depth
Wave Refraction Fig. 17.6
Waves Bending as they Approach the Beach Fig. 17.5 John S. Shelton
Refraction at Headlands and Bays Fig. 17.7
Longshore Drift Fig. 17.8
Sediment transport near shore, parallel to the beach • Longshore drift: sediment carried by swash and backwash along the beach • Longshore currents: currents parallel to the beach within the surf zone
Tides Twice daily rise and fall of the sea caused by the gravitational attraction between • Earth and moon (lunar tides) • Earth and sun (solar tides)
Lunar Tidal Bulges Fig. 17.9
Interaction between lunar and solar tides during the lunar month causes: • Neap tides: when two tidal components are out-of-phase, hence lower than usual, and • Spring tides: when two tidal components are in-phase, hence higher than usual.
Earth-Moon-Sun Alignment and Neap-spring Tides Neap tides Spring tides Fig. 17.10
Mont-Saint-Michel France Exposed tidal flats Fig. 17.11 Thierry Prat/Sygma
Terrace Exposed at Low Tide Fig. 17.12 James Valentine
Tidal Variations – Bay of Fundy High Tide Low Tide
Tidal Variations – Kink Harbor, Alaska High Tide Low Tide
Major parts of beaches • Offshore: from where the waves begin to feel bottom to the surf zone • Foreshore: includes the surf zone, tidal flats, and swash zone • Backshore: from beyond the swash zone to the highest level of the beach
Major Parts of a Beach Fig. 17.13
Sand budget The inputs and outputs of sediment by erosion and sedimentation.
Sand Budget of a Beach Fig. 17.14
Preventing beach erosion • Structural approaches (e.g., groins): typically cause increased erosion downcurrent of structure • Non-structural approaches (e.g., beach nourishment, land use planning): expensive, but don’t cause erosion in new areas
Groin: Built to Prevent Updrift Erosion Causes Downdrift Erosion Erosion Deposition Phillip Plissin/Explorer
Beach Nourishment, New Jersey U.S. Corps of Engineers, New York District
Factors determining rates of erosion or deposition • Uplift • Subsidence • Rock type • Sea-level changes • Wave heights • Tidal range
Sea Stacks Fig. 17.15 Kevin Schafer
Wave-cut Terrace Exposed at Low Tide Fig. 17.16 John S. Shelton
Southern Tip of Cape Cod Fig. 17.17 Steve Durwell/The Image Bank
Past 160 Years of Shoreline Change, Southern Cape Cod Fig. 17.19
Partially Developed Barrier Island Mainland Florida Lagoon BarrierIsland Gulf of Mexico Fig. 17.18 Richard A. Davis, Jr
Uplifted Coastal Terrace Fig. 17.20 John S. Shelton
Mapping the seafloor • Satellite measurements • Echo sounding profiles • Side-scan sonar • Manned and unmanned submersibles
From Gravity Anomaly to Seafloor Topography D.T. Sandwell & W.H.F. Smith/Scripps Institute of Oceanography
Congo Submarine Canyon Echo sounding profile Fig. 17.22
Loiki SeamountImaged Using Side-scan Sonar Fig. 17.23 Ocean mapping Development center, University of Rhode Island
The Benthic Explorer Unmanned Submersible Fig. 17.21 T. Kleindinst/Woods Hole Oceanographic Institute
Atlantic bathymetric features • Continental shelf • Continental slope • Continental rise • Abyssal plains • Seamounts • Mid-ocean ridge
Pacific bathymetric features • Continental shelf • Continental slope • Trench • Abyssal plains • Seamounts • Mid-ocean rise
Continentalshelf Continentalslope Continentalrise Fig. 17.25 Praxton & Haxby, 1996
From the Continental Rise to the Mid-Atlantic Ridge Fig. 17.26
Topography of the North Atlantic Ocean Fig. 17.27 Detail from H.C. Berannrket, based on Heezen & Tharp