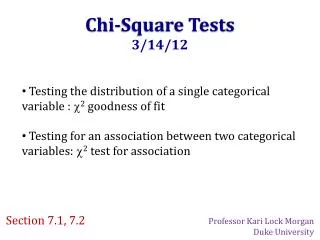
“Categorical Data Analysis 2x2 Chi-Square Tests and Beyond (Multiple Categorical Variable Models)”
260 likes | 286 Vues
This article discusses the basics of Chi-square tests and odds ratios in analyzing categorical data. It also explores logit models and multiway frequency analysis for multiple categorical variables.

“Categorical Data Analysis 2x2 Chi-Square Tests and Beyond (Multiple Categorical Variable Models)”
E N D
Presentation Transcript
“Categorical Data Analysis2x2 Chi-Square Tests and Beyond (Multiple Categorical Variable Models)” Melinda K. Higgins, Ph.D. 6 April 2009
Categorical Data • Categorical data can be distinct groups (such as gender: male, female) or it can be due to some “split” of an originally continuous variable (such as BDI-II (Beck Depression Index) 0-13 not-depressed, above 14 is depressed). • Begin with 2 x 2 tables – understanding basics of Chi-square test and odds ratios • Underlying Logit model more general Log-linear models • What if you have more than 2 categorical variables? Multiway Frequency Analysis (MFA) (or possibly Logistic Regression if one is a an outcome to predict)
2 x 2 Tables (Crosstabs) – Chi-square test • Example from A. Field “Discovering Statistics Using SPSS” • 200 cats – goal: “teach them to line dance” • 2 variables: • Training – food or affection as reward • Dance – did they dance? (yes, no) • 2 ways to enter data into SPSS: • Raw data file 200 rows – 2 columns (training, dance) • Using “weights”
2 x 2 Results • 1st check to make sure that all cell “expected counts” are greater than 5. You will get a warning if any cell is less than 5. If a cell is less than 5 you may want to consider collapsing categories (assuming you have more than 2). • Review %’s – good way to summarize data • The Chi-square test – tests whether the two variables are independent or not (is there an association or not)? • H0: 2 variables are independent [no group differences] • Ha: variables are not independent (are related) [there are differences between the groups]
2 x 2 Results • Chi-square Pval < 0.001, so we reject H0 and conclude there is a relationship between training and whether the cats danced or not. • For the cats who danced, 74% received food as a reward compared to only 26% who received food as a reward for the cats who did not dance. • Odds: • Odds (dancing after food) = number w/food and did dance / number w/food and did not dance = 28/10 = 2.8 • Odds (dancing after affection) = number w/affection did dance / number w/affection did not dance = 48/114 = 0.421 • Odds ratio = Odds-dancing w/food / odds-dancing w/affection = 2.8/0.421 = 6.65 • “If a cat was trained with food, it was 6.65 times more likely to dance.”
Logit Model • As in logistic regression we are interested in predicting the probability of an outcome occurring (rather than predicting the actual value of the outcome) • A “log-likelihood” statistic is used to “assess the fit of the model” [e.g. expected versus observed counts] • So, if the “general form” of this 2x2 chi-square test (as a regression model) is: • Outcomei = (modeli) + errori • Outcomei = (bo + b1Ai + b2Bi + b3ABi) + i • Outcomei = (bo + b1Trainingi + b2Dancei + b3Interactioni) + i • But we’re really predicting the “probability” – so we take the log: • ln(Oi ) = (bo + b1Trainingi + b2Dancei + b3Interactioni) + ln(i)
Multi-way Frequency Analysis[Log-Linear Analysis] • The purpose of multi-way frequency analysis (MFA) is to discover associations among discrete variables. [more than 2x2 and more than 2 levels] [Tabacknick, et.al. 2007] • After preliminary screening for associations, a model is “fit” that includes only the associations necessary to reproduce to observed frequencies (ideally the “simplest” model) • The model’s parameter estimates are used to predict expected frequencies in each “cell.”
“Log-linear/MFA Model”[for 3 variables] “natural log of the expected frequency in cell ijk” “intercept” “main effects” “first-order effects” “2-way interaction effects” “second-order effects” “3-way interaction effect” “third-order effects”
Another Example • Comparison of Reading Material Preference (Science Fiction vs Spy Novels) by Gender and Profession • 155 subjects
Layer = Reading Type[test gender x profession] So it appears there is a difference for Gender x Profession within Reading Type
Some Notes To Remember • If the model contains higher ordered effects, then all lower ordered effects should be retained. • For example, if a two-way intereaction (AB) is significant, then both main effects (A) and (B) should be included. • Likewise, if a third-order effect (ABC) is significant then all two-way interactions (AB, AC, BC) as well as all main effects (A) (B) and (C) should be included. • As such these model are sometimes referred to as “hierarchical or nested” loglinear models.
Full Model Analysis[SPSS HILOGLINEAR] HILOGLINEAR Profession(1 3) Gender(1 2) ReadingType(1 2) /CWEIGHT=Frequency /METHOD=BACKWARD /CRITERIA MAXSTEPS(10) P(.05) ITERATION(20) DELTA(.5) /PRINT=FREQ RESID ASSOCIATION ESTIM /DESIGN. So, from these results, we can conclude, that at least one 2-way effect is significant.
HILOGLINEAR (cont’d) So, from these results, we can conclude, that the profession x gender is important and that reading type is also important. So, let’s look at a reduced model with just these effects.
Reduced Model[Reading Type, Gender, Profession and Profession x Gender] LOGLINEAR Profession (1 3) Gender (1 2) ReadingType (1 2) /PRINT=ESTIM /DESIGN profession*gender profession gender readingtype.
Results – SPSS LOGLINEAR * * * * * * * * * L O G L I N E A R A N A L Y S I S * * * * * * * * * Correspondence Between Effects and Columns of Design/Model 1 Starting Ending Column Column Effect Name 1 2 profession * gender 3 4 profession 5 5 gender 6 6 readingtype - - - - - - - - - - - - - - - - - - - - - - - - - - - - - - - - - - - - - - *** ML converged at iteration 4. Maximum difference between successive iterations = .00000. - - - - - - - - - - - - - - - - - - - - - - - - - - - - - - - - - - - - - - Goodness-of-Fit test statistics Likelihood Ratio Chi Square = 6.55763 DF = 5 P = .256 Pearson Chi Square = 6.58582 DF = 5 P = .253
Estimates for Parameters profession * gender Parameter Coeff. Std. Err. Z-Value Lower 95 CI Upper 95 CI 1 .1060961382 .11944 .88828 -.12801 .34020 2 .5053499863 .12567 4.02116 .25903 .75167 profession Parameter Coeff. Std. Err. Z-Value Lower 95 CI Upper 95 CI 3 .1642139339 .11944 1.37487 -.06989 .39832 4 .0526421582 .12567 .41888 -.19368 .29896 gender Parameter Coeff. Std. Err. Z-Value Lower 95 CI Upper 95 CI 5 -.0149353598 .09030 -.16539 -.19193 .16206 readingtype Parameter Coeff. Std. Err. Z-Value Lower 95 CI Upper 95 CI 6 -.2989185004 .08394 -3.56122 -.46344 -.13440
Summary • This is only a quick introduction – I encourage you to work through the exercises in both Andy Field and Tabacknick, et.al. for more thourough explanations. • Explore the additional features within the SPSS/Loglinear Models section. • Screen your data (for more than 2 categorical variables) using “layers” within the SPSS Crosstabs Procedure.
References • Field, Andy. “Discovering Statistics Using SPSS,” 2nd edition, SAGE Publications, 2005. [Chapter 7 focuses on Logistic Regression; Chapter 16 focuses on Categorical Data.] • Tabachnick, Barbara G.; Fidell, Linda S. “Using Multivariate Statistics,” 5th edition, Pearson Education Inc., 2007. [Chapter 15 focuses on Multilevel Linear Modeling.] *
SON S:\Shared\Statistics_MKHiggins\website2\index.htm [updates in process] Working to include tip sheets (for SPSS, SAS, and other software), lectures (PPTs and handouts), datasets, other resources and references Statistics At Nursing Website: [website being updated] http://www.nursing.emory.edu/pulse/statistics/ And Blackboard Site (in development) for “Organization: Statistics at School of Nursing” Contact Dr. Melinda Higgins Melinda.higgins@emory.edu Office: 404-727-5180 / Mobile: 404-434-1785 VIII. Statistical Resources and Contact Info