Download
1 / 37
370 likes | 505 Vues
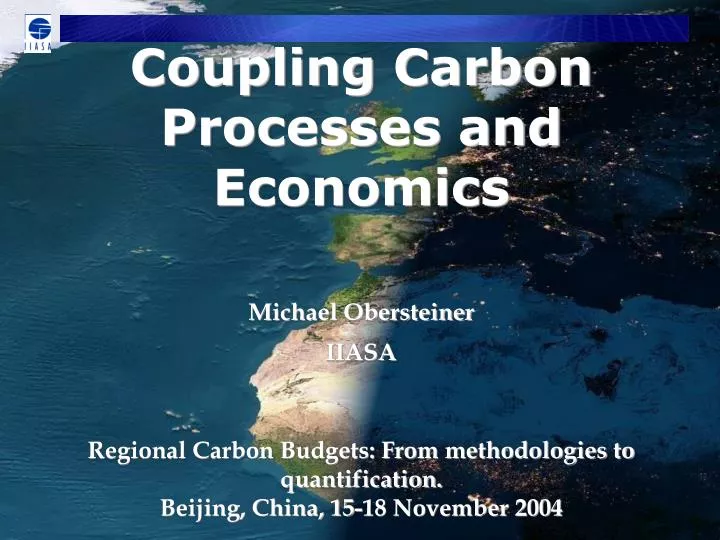
Coupling Carbon Processes and Economics. Michael Obersteiner IIASA Regional Carbon Budgets: From methodologies to quantification. Beijing, China, 15-18 November 2004. Overview. Motivation to manage the carbon cycle Financial Analyst´s point of view Scenarios of what needs to be done

E N D
Coupling Carbon Processes and Economics Michael Obersteiner IIASA Regional Carbon Budgets: From methodologies to quantification. Beijing, China, 15-18 November 2004
Overview • Motivation to manage the carbon cycle • Financial Analyst´s point of view • Scenarios of what needs to be done • What is the biospheric contribution • More trade offs than synergies
Effective compliance with Art. 2 UNFCCC!? 750 ppm 550 ppm 280 ppm
Siemens Ericsson Nokia Risk analysis… the Chartist
Siemens Ericsson Nokia
Data is from the climate system!!! GISP and IPCC data, own calculations
Abrupt Change Concentrations Growing No Analogue Level&speed High volatility
371, ….550,….750…? The obvious number!? Which number would you pick…..?
Gold from Science? • IPCC for the 4th assessment emission scenarios that lead to concentrations of <450 are not planned • No low emission climate runs • No benchmark
Climate Climate Risk Management -Ostriching? • Stabilization target is a SOCIAL CONSTRUCTION • Plausibility of stabilization targets • Little preparation
How to stabilize atmospheric CO2 concentrations • Use less energy • Improve energy efficiency • Life style changes • Stabilize population • Use other forms of energy • Natural gas instead of coal • Renewables • Nuclear • Capture and store carbon • From fossil fuels and/or biomass (in energy conversion plants) • From the atmosphere (in trees, soils or in CO2 capture facilities)
Spatial Distribution of GDP • Important inputs to the spatially explicit forestry and regional agricultural model • Necessary information for vulnerability, adaptation and impact assessment
The cost to stabilise the atmosphere Source Azar & Schneider, 2002. Ecological Economics
A2-Stabilization Scenario(Fossil Intensive) • The figure shows the various sources of GHGs and the mitigation achieved from the baseline in the A2 mitigation scenario • Energy represents the top sector for potential mitigation • Sinks contribute significantly in reduction of forest CO2
Carbon storage possibilities 130 – 500 Gton C Enhanced oil recovery with structural traps 20 – 65 Gton C 30 – 650 Gton C Herzog et alScientific American, February2000. Grimston et al (2001).
Input Modeling Output Management options applied • Biophysical • Climate, CO2 etc… • Land Cover • Relief • Socioeconomic • Population • GDP • Forest sector 1. LUC 2. C sequestration/GHGs 3. Bio4BE production Forest and agri growth modeled Land values LU competition
INTEGRATED POLICY FRAMEWORK Model for GHG Response to Management National Economic Models Scenario Market Regional Farm Type Models Regional Forest Models Farm Models Stand level Models • Common Database and Data Structure • Harmonized System Boundaries • IPCC GPG and /or FGA Accounting • Consistent Baseline Assumptions • Joint Catalogue of GHG Mitigation Measures • Uniform Validation Criteria • Agreed Sustainability Constraints • Common IT Standards • Standard Scenario Assumptions and Story Lines • Joint Vision Common Database and Standards Georeferenced Database
EPIC simulates many processes: Weather: simulated or actual Hydrology: evapotranspiration, runoff, percolation, 5 PET equations,... Erosion: wind and water, 6 erosion equations,... Carbon sequestration: plant residue, manure, leaching, sediment, ... Crop growth: NPK uptake, stresses, yields,N-fixation,... Fertilization: application, runoff, leaching, mineralization, denitrification, volatilization, nitrification,... Tillage:mixing, harvest efficiencies,... Irrigation and furrow diking,... Drainage: depth,... Pesticide: application, movement, degradation,... Grazing: trampling, efficiency,... Manureapplication and transport,... Crop rotations: inter-cropping, weed, competition, annual and perennial crops,... on a daily time step
Overview of the Regional Agri-Model Model inputs - Prices - Technical parameters - CAP-related parameters • Data • (FADN) • - Yields • Area • Variable costs • - Producing activities • - Size of farms • Altitude • … • Other sources • Emissions coefficients • Soils characteristics • Fertilizer uses and prices • … Estimation Typology 15 countries, 101 regions 734 farm-types • 734 models • Maximize gross margin • Subject to : • Technical constraints • Policy constraints Calibration Model output - Optimal area - Livestock numbers - Animal feeding - Net emissions
Basic Modeling Forestland Forest Production Biofuel/GHG Demand Cropland Domestic Demand Water Markets Crop Production Labor Export Natl. Inputs Processing Import Other Resources Livestock Production Feed Mixing Pasture Land AUM Grazing
Afforestation CH4 N2O Ag-Soil sequestration Mitigation Strategy Equilibrium 500 400 Biofuel offsets 300 Carbon price ($/tce) 200 100 0 0 20 40 60 80 100 120 140 160 180 200 Emission reduction (mmtce)
Land Use Change until 2100 for B1Intensity map: (affected) ha x C-uptake Existing forest Afforestation Deforestation
Wrap-up • Slumbering Beast • Much lower stabilization targets are NECESSARY AND PLAUSIBLE • The Problem is currently with the fossil fuels and a large(st) potential of the solution is in the Agri&Forestry&Bioenergy sector.
Winning is not easy • Carbon price (tax or cap-and-trade system) • Energy efficiency standards • Support technology development • Agi&Forestry market reform • Minimize associated social and environmental costs
371, ….550,….750…? THANK YOU!
Climate Policy Sector Policy / Technology Energy Market Policy Carbon permit Electricity Electricity Pulp / paper ? Biomass Land use Policy
Modular Commitment Strategy CO2 El \pi BM
Diversity of Approaches • Engineering models & Biophysical Model • Equilibrium Approaches (Static – Dynamic) • Spatially Explicit and Multisectoral • Risk and Uncertainty Augmented
Policy Integration Goal • Contribute to integrate sinks in ETS • GPG (accounting, certification, verification) • Cost competitiveness and potentials • Transaction Cost • Contribute to policy formulation • CAP • Energy • Climate • Forestry • Clean Air • …