GPRS optimisation and Network visualization
GPRS optimisation and Network visualization. Topics. What do we need to know? Different types of information available Basics of GPRS capacity optimisation. Planning. The network elements: type specific information (e.g. family, radiation patterns) current settings Geographic information

GPRS optimisation and Network visualization
E N D
Presentation Transcript
GPRS optimisation and Network visualization Janne Myllylä T-110.456
Topics • What do we need to know? • Different types of information available • Basics of GPRS capacity optimisation Janne Myllylä T-110.456
Planning • The network elements: • type specific information (e.g. family, radiation patterns) • current settings • Geographic information • Land use • Building height • Statistics • Models Janne Myllylä T-110.456
Planning • Using the information we can estimate: • Network capacities in different areas • Overall service quality • Affect of changes in the network • Problems: • Models work in a perfect world • Map information is never up-to-date or accurate • Butterfly effect Janne Myllylä T-110.456
Are there more accurate methods? • Network performance can also be measured • Field measurements • Network measurements Janne Myllylä T-110.456
Optimise Analyse Provision NokiaNetAct Measure Optimisation basics Janne Myllylä T-110.456
Measurement types • Call/Session • Radio Quality • Volume Janne Myllylä T-110.456
Field measurements • + • Basically a modified cellural phone is driven on a route. • Reliable information available without much traffic volume • Vendor independent • Can measure competitors network performance • - • A lot of driving around needed. • Measurement sample time is very limited Janne Myllylä T-110.456
Network measurements • + • Almost all possible events are measured. • Measurements span over a longer timeperiod • - • Not very standardized. Different vendors measure and collect slightly different data. • Moderate traffic volume is needed for reliable measurements. • The total amount of data is huge. Janne Myllylä T-110.456
Busy Hour • The distribution of traffic is not even. During weekdays there occurs peaks in the network usage. • Radio networks don’t generally react well to traffic increase • According to common sence: Network behaviour during the busy hour is the weakest link. • Heuristics can be used to identify the bh. Janne Myllylä T-110.456
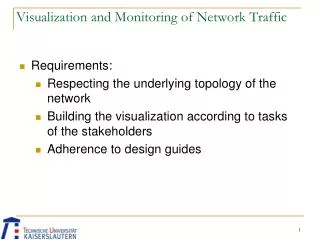
What is visualized • Network static information • Locations & directions • Parameter values • Relations between elements Janne Myllylä T-110.456
What is visualized • There are dozens of raw measurements (Performance Indicator) that are related to GPRS performance. • User wants to see the result of a preliminary analysis based on the raw measurements (Key Performance Indicator). Janne Myllylä T-110.456
KPI • Traditional benchmarks ( BER, FER, CSR, HSR ) • (E) GPRS data related • Reliability, max probability of erroneous RLC • Throughput, amount of RLC payload • Delay, measured time between SGSN and mobile • (E)GPRS load, timeslots utilized by GPRS service • And many more Janne Myllylä T-110.456
Visualizing KPI • Snaphot of network state: • Performance of network on map • List of elements not behaving within thresholds • Trend of measurements • Time based comparison between different elements / measurements • Performance animations on map Janne Myllylä T-110.456
Network capacity balancing • In GSM network the available capacity is defined by timeslots dedicated for different services. • It is possible to dimension timeslot usage between • SDCCH • CS • PS Janne Myllylä T-110.456
Visualization of timeslot usage Janne Myllylä T-110.456
Visualizing service performance Janne Myllylä T-110.456
Visualizing cell level performance Janne Myllylä T-110.456
Effect of timeslot redimensioning % The relevant analysis ofservice performance need tobe continuous, since withoutincrease of total capacitytimeslot dimensioning is alwayscompromise. Janne Myllylä T-110.456
Treatment classes • Assigning GPRS capacity for different service classes • PoC • Streaming • Corporate • MMS • Diverse DL/UL QoS requirements. Janne Myllylä T-110.456
Capacity offered for various services Capacity and QoS Capacity Balancing QoS Priorisation SMS Speech GPRS TREC 3 • Priorisation TREC 2 TREC 1 TREC 0 Janne Myllylä T-110.456
Running out of capacity Dimensioning can nowonly be used to increaseCS performance.The only way to improve PSperformance is to increasethe total capacity. Janne Myllylä T-110.456
How to increase capacity • Some of the traffic volume could be redirected to other cells • A new serving cell can be setup • TRXs can be added for the current cell(s) to increase total amount of timeslots • Impact matrix Janne Myllylä T-110.456
Impact matrix • Also known as Interference matrix • All cells whose signal has been measured in servingcells dominance area • Handover possibility • Used to determine which cells could cause interferencewith serving cell. Janne Myllylä T-110.456
Interference basics • The frequencies have traditionally been planned usingreuse patterns and propagation models • In order to increase the traffic capacity, the channel re-use becomes tighter • Too tight use of the same and adjacent channels causes a decline of C/I BER and FER increase, worse coding schemes Janne Myllylä T-110.456
Interference without hopping • When no hopping is used some timeslots will constantly have more problems than others. • After too much reuse performance deteriorates quickly Janne Myllylä T-110.456
Too tight reuse on map Janne Myllylä T-110.456
Averaging behaviour • Frequency hopping may be used to average networkbehaviour • Main idea is to reduce continuous bad performancebetween mobile and bss. Janne Myllylä T-110.456
Averaged behaviour on map Janne Myllylä T-110.456
Hopping mode: BB • In BB hopping TRX frequencies don’t change, but TRX serving the mobile phone does. • Total amount of frequencies in BB hopping is the same as the number of TRXs. • Also BCCH timeslots 1-7 are included in the hopping. Janne Myllylä T-110.456
Hopping mode: RF • In RF hopping TRX serving the mobile phone doesn’t change, but TRX frequencies do. • In RF hopping an allocation list contains frequenciesthat are used. • BCCH TRX is not hopping. • N channels enables 64*N different hopping sequences. • MAIO offset has as many values as allocation list has channels • HSN can be selected from 64 different sequences. Janne Myllylä T-110.456
Hopping mode comparison Mobile hops the same frequency pattern in both modes Janne Myllylä T-110.456
Measured performance DCR EFL Basically RF hopping enables a more tight channel reuse Janne Myllylä T-110.456
Extreme channel reuse • Two types of service areas inside cell: • Normal with regular reuse patterns (overlay) • Small with extreme reuse (underlay) • The same underlay frequencies are used even in neighboring cells. • Cell tries to make as much as possible of the traffic volume to use the underlay frequencies. Janne Myllylä T-110.456
Extreme channel reuse • The same traffic volume can be managed with lessfrequencies. • With this example situation 3 underlay TRXs could free 6 frequencies. underlay Janne Myllylä T-110.456
References 3GPP TS 25.215 V6.0.0 Physical layer – measurements 3GPP TS 23.107 V6.2.0 QoS concept and architecture Halonen, Romero, Melero: GSM, GPRS and EDGE performance Janne Myllylä T-110.456