Understanding Decay Modes in Nuclear Physics and the N-Z Chart
This lesson focuses on the decay modes of radioactive isotopes, emphasizing the interpretation of the N-Z chart. Students will learn how alpha (α), beta minus (β-), and beta plus (β+) decay are represented on the chart and their relevance in radioactive series. The lesson covers nuclear energy levels, neutron and proton relationships for stable isotopes, and how decay affects nuclear stability. Exercises include drawing the N-Z graph, indicating decay types, and discussing photon emissions from excited nuclei. Key objectives include calculating photon frequencies and understanding emission processes.

Understanding Decay Modes in Nuclear Physics and the N-Z Chart
E N D
Presentation Transcript
More About Decay Modes Nuclear Physics Lesson 9
Homework Revise for the skills test. HWK days: Tues Wk 1 Period 4 Mon Wk 2 Period 2 Thurs Wk 2 Period 4 Nuclear Physics Test - some time before half term.
Learning Objectives To interpret the N-Z chart for radioactive isotopes. To know how α, β- and β+ decay are represented on the N-Z chart. To apply this to a radioactivity series. To know how to represent nuclear energy levels.
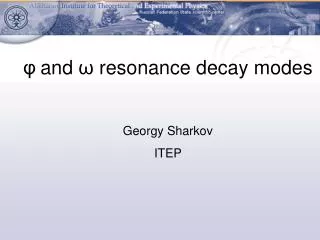
b- A b+ B Neutron number n p + b- + n p n +b++ n Proton number N-Z Plot
Notes on the N-Z Plot For light elements (Z < 20), N is roughly equal to Z for stable protons, i.e. equal numbers of protons and neutrons. As the elements get heavier, more neutrons are needed for the strong force to overcome the Coulomb repulsion (50% more N than Z for the heaviest elements). so the line of stability bends upwards.
Notes on the N-Z Plot α emitters (Z > 60) β- emitters (above the stability line) β+ emitters (below the stability line)
Decays Represented on N-Z Plot You need to know how to show α, β- and β+. THIS GRAPH IS THE WRONG WAY ROUND!
Exercise Draw the N-Z graph for known isotopes. Indicate the line of stability and describe how and why it changes as Z is increased. Indicate where the α, β- and β+ emitters will appear on the graph. Explain why they appear in these regions of the graph.
Nuclear Energy Levels After a nucleus has emitted an alpha or a beta particle, the daughter nucleus may be in an excited state. This will cause it to emit a photon as it de-excites. It works just like electrons making transitions between atomic energy levels – but it takes place in the nucleus
Exercise • Describe the two ways that a 0.83 MeV photon can be emitted? • Explain how the beta decay of Mg-27 can result in either 1 or 2 photons being emitted. • Calculate the 3 photon frequencies possible.
Summary A graph of neutron number against proton number shows that there are more neutrons in larger nuclei. This is needed to ensure stability of the nuclei. Excited nuclei give off gamma rays after emitting an alpha particle or a beta particle.
Recap How are gamma rays emitted by the nucleus?