Recipe for a successful application
Recipe for a successful application. J. Andreeva 1 , I . Dzhunov 1 , J. Flix 2 , S . Gayazov 1 , A. Di Girolamo 1 , P . Karhula 1 , L. Kokoszkiewicz 1 P. Kreuzer 3 , M. Nowotka 1 , A. Sciaba 1 , P. Saiz 1 , J. Schovancova 4 , D.Tuckett 1

Recipe for a successful application
E N D
Presentation Transcript
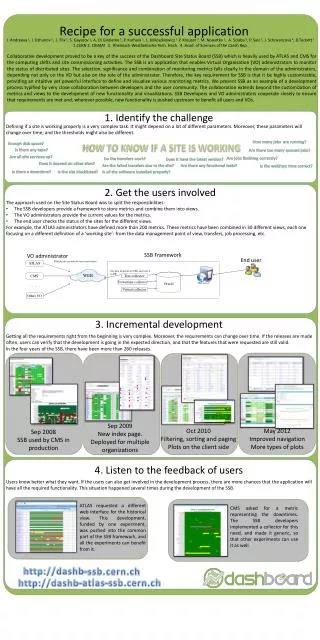
Recipe for a successful application J. Andreeva 1, I. Dzhunov1, J. Flix 2, S. Gayazov1, A. Di Girolamo 1, P. Karhula1, L. Kokoszkiewicz1P. Kreuzer3, M. Nowotka1, A. Sciaba1, P. Saiz 1, J. Schovancova4, D.Tuckett1 1.CERN 2. CIEMAT 3. Rheinisch-WestfaelischeTech. Hoch. 4. Acad. of Sciences of the Czech Rep. Collaborative development proved to be a key of the success of the Dashboard Site Status Board (SSB) which is heavily used by ATLAS and CMS for the computing shifts and site commissioning activities. The SSB is an application that enables Virtual Organisation (VO) administrators to monitor the status of distributed sites. The selection, significance and combination of monitoring metrics falls clearly in the domain of the administrators, depending not only on the VO but also on the role of the administrator. Therefore, the key requirement for SSB is that it be highly customizable, providing an intuitive yet powerful interface to define and visualize various monitoring metrics. We present SSB as an example of a development process typified by very close collaboration between developers and the user community. The collaboration extends beyond the customization of metrics and views to the development of new functionality and visualizations. SSB Developers and VO administrators cooperate closely to ensure that requirements are met and, wherever possible, new functionality is pushed upstream to benefit all users and VOs. 1. Identify the challenge Defining if a site is working properly is a very complex task. It might depend on a lot of different parameters. Moreover, these parameters will change over time, and the thresholds might also be different. How many jobs are running? Enough disk space? HOW TO KNOW IF A SITE IS WORKING Is there any tape? Are there too many queued jobs? Are all site services up? Are jobs finishing correctly? Do the transfers work? Does it have the latest version? Does it depend on other sites? Are the failed transfers due to the site? Are there any functional tests? Is the wall/cpu time correct? Is there a downtime? Is the site blacklisted? Is all the software installed properly? 2. Get the users involved • The approach used on the Site Status Board was to split the responsibilities: • The SSB developers provide a framework to store metrics and combine them into views. • The VO administrators provide the current values for the metrics. • The end user checks the status of the sites for the different views. • For example, the ATLAS administrators have defined more than 200 metrics. These metrics have been combined in 30 different views, each one focusing on a different definition of a ‘working site’: from the data management point of view, transfers, job processing, etc. 3. Incremental development Getting all the requirements right from the beginning is very complex. Moreover, the requirements can change over time. If the releases are made often, users can verify that the development is going in the expected direction, and that the features that were requested are still valid. In the four years of the SSB, there have been more than 260 releases. SSB Framework VO administrator End user Publish info on web server in text format ATLAS Get data from known URL and store it in DB WEB Oracle CMS Text collector Downtime collector Web server Virtual collector Other VO Sep 2009 New index page. Deployed for multiple organizations Oct 2010 Filtering, sorting and paging Plots on the client side Apr 2012 Easier navigation More types of plots Sep 2008 SSB used by CMS in production May 2012 Improved navigation More types of plots 4. Listen to the feedback of users Users know better what they want. If the users can also get involved in the development process, there are more chances that the application will have all the required functionality. This situation happened several times during the development of the SSB. ATLAS requested a different web interface for the historical view. This development, funded by one experiment, was pushed into the common part of the SSB framework, and all the experiments can benefit from it. CMS asked for a metric representing the downtimes. The SSB developers implemented a collector for this need, and made it generic, so that other experiments can use it as well. http://dashb-ssb.cern.ch http://dashb-atlas-ssb.cern.ch