Download
1 / 10
100 likes | 215 Vues
This study focuses on the extraction of electron-induced molecular desorption coefficients via an electron detector at RHIC, exploring the pressure changes in the presence of electron clouds. Various calibration techniques for the detector are discussed, alongside simulations that showcase electron flux behaviors. The research distinguishes between baked and unbaked stainless steel, evaluating the impact of surface conditioning on desorption rates. Finally, a characterization of the electron energy spectrum is presented, highlighting significant findings on low-energy and high-energy electron interactions.

E N D
Extracting the electron-induced molecular desorption coefficient using an electron detector Ubaldo Iriso Many thanks to: M. Blaskiewicz, A. Drees, W. Fischer, H. Hseuh, S. Peggs, G. Rumolo, R. Tomás, P. Thieberger, and S.Y. Zhang
Contents • Introduction • Calibration of the RHIC e-detector • Snapshot examples • Electron-induced molecular desorption • Evolution of he for baked and unbaked surfaces • Electron energy spectrum • Conclusions
Grid 1 Beam pipe Grid 2 + + + + e- Collector e- Grid 1: energy filter Grid 2 (-10 V) Collector (+50 V) 1. Introduction • Electron detector at RHIC (very similar to APS, SPS, KEK…) RF shield: decrease image currents 12cm
1.a. Calibration of the RHIC e-detector Bandwidth calibration of the ED the system electronics and/or cable length does not affect the signal below 50MHz (3 dB limit) Electron detector transparency*: % of electrons that traverse all the grids and can reach the collector These two calibrations provide the e- flux to the wall for a given ED voltage Z : line impedance G : amplifier gain AED: ED surface Teff : effective transparency See *P. He et al, TPAG004, PAC’03.
1.b. Snapshot examples: Simulation of an e-cloud build up: Polarizing ‘grid 1’ filters e- energy: Peak e-flux Average e-flux • Distinguish between peak e- signal and average e-signal • Filter electron energy
2. Electron induced molecular desorption The pressure in presence of an e-cloud*: he = # molecules / electron <dI/dl> = linear electron flux to the wall, time averaged over one turn 2S = pumping speed • Assuming a periodic structure (pumps spaced by 2L) • z origin at a vacuum pump location Experimental setup at BO2 in RHIC (unbaked stainless steel): e-detector (ED) location Pumps&gauges location • *See U. Iriso and W. Fischer, PRST-AB, 8, 113201, 2005
2. Electron induced molecular desorption Evolution of the average flux and pressure during electron clouds at BO2 Using a simple linear regression, infer desorption coefficient he. In this case, he = 0.01 ± 50%. (error stems from the uncertainty in pressure readings and pumping speed values)
3. Evolution of he for baked and unbaked stainless steel • Following the evolution of he evaluation of the surface conditioning Unbaked stainless steel (“BO2”) Baked stainless steel (“IR12”) • Unbaked stainless steel suffers small conditioning. • Baked surfaces do not seem to suffer any scrubbing (low energy e-, low flux, or both)
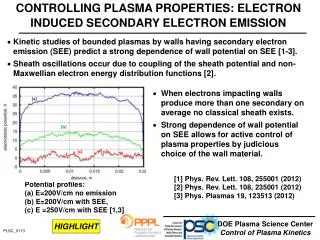
4. Energy spectrum Since the desorption coefficient depends a lot on the electron impact energy, it is relevant to characterize the energy spectrum. <Nb> ~ 1.6e11 protons/bunch bunch spacing = 107ns 45 bunches in the machine • Large peak of low energy e- (~10eV) • Espectrum extends up to ~300eV – upper limit cannot be precisely determined because of the high ED noise.
5. Conclusions • A proper calibration of the ED allows to infer the electron flux into the wall • Using the pressure and ED readings, the desorption coefficient is inferred for both baked and unbaked surfaces. • Baked heare about an order of magnitude lower than unbaked he , and results are consistent with laboratory measurements • The electron energy spectrum during multipacting extends up to ~300eV (low fraction). The spectrum shows a large peak at low energy (~10eV).