Download
1 / 39
390 likes | 517 Vues
This document presents an analysis of the outcomes from the Texas Radiation Protection Program, detailing its regulatory framework and performance indicators. Key insights include reliance on inspection results, reported incidents, and complaints to measure success, given the rarity of acute radiation injuries. Historical data from 1956 to 2000 on violations, overexposures, and incidents are discussed, highlighting trends and areas for improvement in radiation safety. The comprehensive dataset aims to inform better public health practices and regulatory adjustments.

E N D
Texas Radiation Protection Program Outcomes Robert Emery, DrPH, CHP, CIH, CSP, RBP, CHMM, CPP, ARM Vice President for Safety, Health, Environment & Risk Management The University of Texas Heath Science Center at Houston Associate Professor of Occupational Health The University of Texas School of Public Health 1851 Crosspoint Drive OCB 1.330 Houston, Texas (713) 500-8100
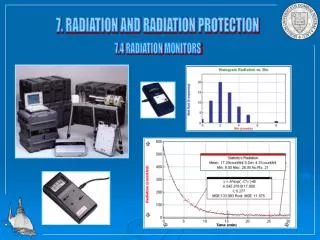
Radiation Protection Program Outcomes • Ideally, a public health regulatory control program would rely on health outcome data as its “systemic” outcome measure of performance • But since acute radiation injuries are rare, and latent illnesses possibly not recognized as radiation-related, other “organic” outcome indicators must be relied upon, such as: • Inspection results (violations) • Reported incidents • Reported complaints • Specific events • Misadministration/dose irregularities • Overexposures • Stolen sources
Scope of Texas Operations • Approximately 15,000 registrants of radiation producing devices • Approximately 1,500 licensees of radioactive materials • All permit holders are inspected on a pre-determined schedule
Outcome Data • DSHS maintains extensive records on • Violations • Incidents, complaints • UTHSCH students accessed this data from as far back as 1956 • Format varied from paper, floppy disk, CD • Entered into standardized electronic format • Represents the most comprehensive radiation protection outcome dataset in the nation • What can we learn from the data….
Procedures 11% Absent surveys 10% Leak testing 8% Personnel monitoring 7% Instrument calibration 7% Inventories 6% Transfer records 6% Disposal records 4% Main program 4% Training 2% Licensees: Top Ten Violations 1988-1997 Total† 65% †Annual Top Ten Varied from 55% to 75% of all NOVs
OS&P NC/NA 20% Time/temp chart 11% No QC 10% Alignment 7% Annual PE tests 6% Technique chart 5% Reg not current 4% Dosimetry 4% Timer 3% “Other x-ray” 3% Registrants: Top Ten Violations 1988-1997 Total† 73% †Annual Top Ten Varied from 61% to 78% of all NOVs
Summary of Reported Incidents in Texas from 1988-1997 Unauthorized Source Unauthorized Unauthorized Release Use Unauthorized Unauthorized Storage Possession 0% 0% Disposal 0% 0% 3% Transportation Uranium Spill Accident 1% 2% Badge Overexposure Source Stolen 14% Contamination Source Lost 3% 4% 7% Source Found Elevated Bioassay 4% 1% Source Fire Equipment Damaged 1% 2% Source Downhole 2% Improper Storage Source Disconnect 0% 3% Improper Transport Safety Violations 0% Irregularity 0% 8% Radiation Injury Leaking Source 1% 3% Malfunction 3% Overexposure (n=2,026) Misadministration 28% 8%
2000 1800 1600 1400 1200 1000 Number of Licenses 800 600 400 200 0 1970 1975 1980 1985 1990 1995 2000 Year Active Radioactive Materials Licenses In Texas, 1970 to 2000
Reported overexposure events compared to the number of radioactive licenses issued in Texas, 1970 to 2000
Total overexposures in Texas, 1970 to 2002 Radiographer training requirement Regulatory dose limit change
Overexposure Incidents in Texas 1956-2000 By Source (n=2,066)
Overexposure Incidents in Texas 1956-2000 by Dose Rate (n = 2,066)
Overexposure Incidents in Texas by Total Dose, 1956-2000 (n = 2,066)
Rig count 1970 to 2004 and Total overexposures 1970 to 2002, in Texas
Rig count 1970 to 2004 and Total overexposures 1970 to 2002, in Texas Radiographer training requirement Regulatory does limit change
Rig count 1970 to 2007 and Total overexposures 1970 to 2002, in Texas
Occupational Overexposure Incidents in Texas 1956-2000 by Dose Rate (n = 1,983) 17% exceeded annual 5 rem limit 79% exceeded quarterly 1.25 rem dose limit Classic Heinrich’s ratio – for every 1 major accident, there were likely 30 minor events and perhaps 300 unsafe acts. An especially useful concept for rare events, by monitoring for the precursors to the major accident. The problem is…..
Occupational Overexposure Incidents in Texas 1956-2000 by Dose Rate (n = 1,983) 17% exceeded annual 5 rem limit The baseline surveillance indicator of “unsafe acts” for radiation doses is now missing!
Stolen Source Events Fig. 5 Characteristics associated with reported stolen source events in Texas, 1956-2000 (n=113)
Reported Stolen Source Events in Texas, 1956 to 2000 by transporter (n=64)
Summary Observations • The collective performance of the radiation safety profession (inclusive of regulators and permitted community) has been very good, and should be considered a model for other public health efforts. • The ultimate outcome, overexposures, has dramatically decreased as a rate over time. • Longitudinal data analysis affords the identification of some interesting trends and commonalties that can be used to further improve the process
Putting Radiation Risks Into Perspective: The Public Health Significance of Workplace Safety • In 2007 there were: • 5,657 workplace fatalities • That’s 15 people per day that left for work and didn’t come home • 4,002,700 recordable workplace injuries or illnesses • That’s a workplace injury or illness being recorded every 10 seconds • Fires, which are only one of many property “perils", resulting in $14,639,000,000 in direct property loss Sources bls.gov, nfpa.org
Special UT SPH Student Acknowledgment Special thanks goes to the students who collectively worked on the assembly of this data for the benefit of their academic pursuits and the State of Texas
References • Emery, R.J., Pollock, J., Charlton, M., "Notices of Violation Issued to Texas Radioactive Material Licensees Inspected in 1995", Health Physics, 73(4): 706-709, 1997. • Emery, R.J., Charlton, M.A., Goodman, G.R., “Texas Radiation Safety Program Outcomes as Indicated by Regulatory Compliance Activities from 1988 to 1997” Health Physics, 78(3): 335-342, 2000. • Emery, R.J., Charlton, M.A., Mathis, J.L, "Estimating the Administrative Cost of Regulatory Noncompliance: A Pilot Method for Quantifying the Value of Prevention", Health Physics 78(Supplement 2): S40-S47, 2000. • Emery, R.J., Charlton, M.A., Orders, A. B., Hernandez, M. "Using Fault Tree Analysis to Identify Causes of Non-Compliance: Enhancing Violation Outcome Data for the Purposes of Education and Prevention" Health Physics, 80(Supplement 1): S16-S21, 2001. • Charlton, M.A., Emery, R.J., "Radioisotope Misadministration and Dose Irregularity Trends in Texas" Health Physics, 81(5): 585-591; 2001. • Emery, R.J., Orders, A.O., Charlton, M.A. "Piloting a New Radiation Protection Program Strategy: Rewarding Compliance Rather Than Sanctioning Non-compliance "Health Physics, 82(Supplement 1):S18-S22; 2002.
References • Emery, R.J., Orders, A.B., McCrary, J.R., Charlton, M.A. "An Evaluation and Comparison of Compliance Inspection Outcome Data for Radiation Protection Programs in Maine and Texas" Health Physics, 82(3): 395-399, 2002. • Emery, R.J., Orders, A.O., Charlton, M.A., "Texas Dental X-ray Compliance: An Analysis of Trends for the Purposes of Education and Prevention" Texas Dental Journal, 119(9) 916-921, 2002. • Maness, K., Emery, R.J., Casserly, D., “An Analysis of 45 Years of Reported Overexposure Incidents in Texas, 1956 to 2001” Health Physics Journal, 86(2): 197-202, 2004. • Brown, B.J., Emery, R.J., Stock, T., Lee, E.S., “Radiation Protection Program Outcomes as Assessed by the Results of Compliance Inspections in Washington, as Compared to the States of Texas and Maine”. Health Physics Journal, 86(3):308-315; 2004. • Emery, R.J., Valizadeh, F., Kennedy, V., Shelton, A. “An Analysis of Variables Influencing the Number of Radiation Overexposure Events in Texas from 1970 to 2000” Health Physics Journal, in press. • Korshukin, M., Emery, R.J., “An Analysis of Reported Events of Stolen Sources of Radioactivity in Texas from 1956 to 2000 “ Health Physics Journal, in publication.