Download
1 / 1
10 likes | 149 Vues
A preliminary study of the movements of pelagic estuarine fishes with special reference to bluefish ( Pomatomus saltatrix ). Lauren Rizzo ¹ , John Manderson ² , Jeffrey Pessutti², John Rosendale², Beth Phelan².

E N D
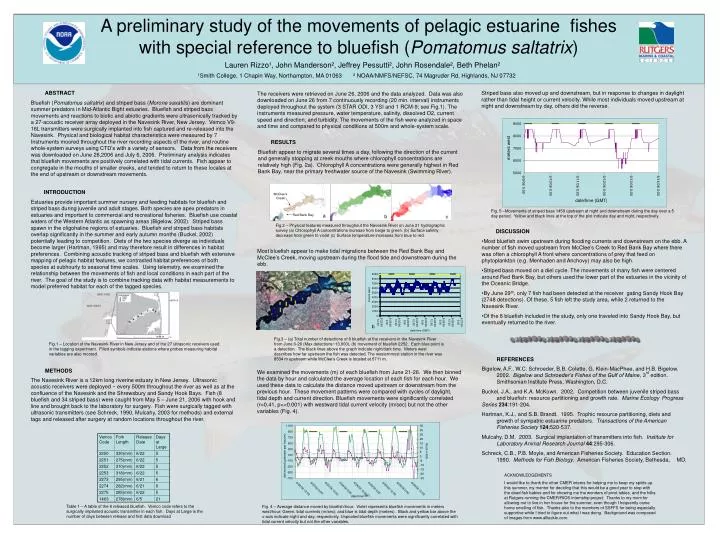
A preliminary study of the movements of pelagic estuarine fishes with special reference to bluefish (Pomatomus saltatrix) Lauren Rizzo¹, John Manderson², Jeffrey Pessutti², John Rosendale², Beth Phelan² ¹Smith College, 1 Chapin Way, Northampton, MA 01063 ² NOAA/NMFS/NEFSC, 74 Magruder Rd, Highlands, NJ 07732 ABSTRACT Bluefish (Pomatomus saltatrix) and striped bass (Morone saxatilis) are dominant summer predators in Mid-Atlantic Bight estuaries. Bluefish and striped bass movements and reactions to biotic and abiotic gradients were ultrasonically tracked by a 27-acoustic receiver array deployed in the Navesink River, New Jersey. Vemco V9-16L transmitters were surgically implanted into fish captured and re-released into the Navesink. Physical and biological habitat characteristics were measured by 7 Instruments moored throughout the river recording aspects of the river, and routine whole-system surveys using CTD’s with a variety of sensors. Data from the receivers was downloaded on June 26,2006 and July 6, 2006. Preliminary analysis indicates that bluefish movements are positively correlated with tidal currents. Fish appear to congregate in the mouths of smaller creeks, and tended to return to these locales at the end of upstream or downstream movements. Striped bass also moved up and downstream, but in response to changes in daylight rather than tidal height or current velocity. While most individuals moved upstream at night and downstream by day, others did the reverse. The receivers were retrieved on June 26, 2006 and the data analyzed. Data was also downloaded on June 26 from 7 continuously recording (20 min. interval) instruments deployed throughout the system (3 STAR ODI, 3 YSI and 1 RCM-9; see Fig.1). The instruments measured pressure, water temperature, salinity, dissolved O2, current speed and direction, and turbidity. The movements of the fish were analyzed in space and time and compared to physical conditions at 500m and whole-system scale. RESULTS Bluefish appear to migrate several times a day, following the direction of the current and generally stopping at creek mouths where chlorophyll concentrations are relatively high (Fig. 2a). Chlorophyll A concentrations were generally highest in Red Bank Bay, near the primary freshwater source of the Navesink (Swimming River). INTRODUCTION Estuaries provide important summer nursery and feeding habitats for bluefish and striped bass during juvenile and adult stages. Both species are apex predators in estuaries and important to commercial and recreational fisheries. Bluefish use coastal waters of the Western Atlantic as spawning areas (Bigelow, 2002). Striped bass spawn in the oligohaline regions of estuaries. Bluefish and striped bass habitats overlap significantly in the summer and early autumn months (Buckel, 2002) potentially leading to competition. Diets of the two species diverge as individuals become larger (Hartman, 1995) and may therefore result in differences in habitat preferences. Combining acoustic tracking of striped bass and bluefish with extensive mapping of pelagic habitat features, we contrasted habitat preferences of both species at subhourly to seasonal time scales. Using telemetry, we examined the relationship between the movements of fish and local conditions in each part of the river. The goal of the study is to combine tracking data with habitat measurements to model preferred habitat for each of the tagged species. McClee’s Creek Fig. 5 –Movements of striped bass 1459 upstream at night and downstream during the day over a 5 day period. Yellow and black lines at the top of the plot indicate day and night, respectively. a Red Bank Bay b c Fig.2 – Physical features measured throughout the Navesink River on June 21 hydrographic survey (a) Chlorophyll A concentrations increase from beige to green. (b) Surface salinity decrease from green to violet (c) Surface temperature increases from blue to red. • DISCUSSION • Most bluefish swim upstream during flooding currents and downstream on the ebb. A number of fish moved upstream from McClee’s Creek to Red Bank Bay where there was often a chlorophyll A front where concentrations of prey that feed on phytoplankton (e.g. Menhaden and Anchovy) may also be high. • Striped bass moved on a diel cycle. The movements of many fish were centered around Red Bank Bay, but others used the lower part of the estuaries in the vicinity of the Oceanic Bridge. • By June 29th, only 7 fish had been detected at the receiver gating Sandy Hook Bay (2748 detections). Of these, 5 fish left the study area, while 2 returned to the Navesink River. • Of the 8 bluefish included in the study, only one traveled into Sandy Hook Bay, but eventually returned to the river. Most bluefish appear to make tidal migrations between the Red Bank Bay and McClee’s Creek, moving upstream during the flood tide and downstream during the ebb. a b Fig.3 – (a) Total number of detections of 8 bluefish at the receivers in the Navesink River from June 6-26 (Max detections~13,000), (b) movement of bluefish 2252. Each blue point is a detection. The black lines above the graph indicate night/dark time. Meters west describes how far upstream the fish was detected. The westernmost station in the river was 8534 m upstream while McClee’s Creek is located at 5711 m. Fig.1 – Location of the Navesink River in New Jersey and of the 27 ultrasonic receivers used in the tagging experiment. Filled symbols indicate stations where probes measuring habitat variables are also moored. REFERENCES Bigelow, A.F., W.C. Schroeder, B.B. Colette, G. Klein-MacPhee, and H.B. Bigelow. 2002. Bigelow and Schroeder’s Fishes of the Gulf of Maine, 3rd edition. Smithsonian Institute Press, Washington, D.C. Buckel, J.A., and K.A. McKown. 2002. Competition between juvenile striped bass and bluefish: resource partitioning and growth rate. Marine Ecology Progress Series234:191-204. Hartman, K.J., and S.B. Brandt. 1995. Trophic resource partitioning, diets and growth of sympatric estuarine predators. Transactions of the American Fisheries Society124:520-537. Mulcahy, D.M. 2003. Surgical implantation of transmitters into fish. Institute for Laboratory Animal Research Journal 44:295-306. Schreck, C.B., P.B. Moyle, and American Fisheries Society. Education Section. 1990. Methods for Fish Biology. American Fisheries Society, Bethesda, MD. METHODS We examined the movements (m) of each bluefish from June 21-26. We then binned the data by hour and calculated the average location of each fish for each hour. We used these data to calculate the distance moved upstream or downstream from the previous hour. These movement patterns were compared with cycles of daylight, tidal depth and current direction. Bluefish movements were significantly correlated (r=0.41, p<<0.001) with westward tidal current velocity (m/sec) but not the other variables (Fig. 4). The Navesink River is a 12km long riverine estuary in New Jersey. Ultrasonic acoustic receivers were deployed ~ every 500m throughout the river as well as at the confluence of the Navesink and the Shrewsbury and Sandy Hook Bays. Fish (8 bluefish and 34 striped bass) were caught from May 5 – June 21, 2006 with hook and line and brought back to the laboratory for surgery. Fish were surgically tagged with ultrasonic transmitters (see Schreck, 1990, Mulcahy, 2003 for methods) and external tags and released after surgery at random locations throughout the river. ACKNOWLEDGEMENTS I would like to thank the other CMER interns for helping me to keep my spirits up this summer, my mentor for deciding that this would be a good year to stop with the dead fish babies and for showing me the wonders of pivot tables, and the folks at Rutgers running the CMER/RIOS internship project. Thanks to my mom for allowing me to live in her house for the summer, even though I frequently came home smelling of fish. Thanks also to the members of SSFFS for being especially supportive while I tried to figure out what I was doing. Background was composed of images from www.alltackle.com. (GMT) Table 1 – A table of the 8 released bluefish. Vemco code refers to the surgically implanted acoustic transmitter in each fish. Days at Large is the number of days between release and first data download Fig. 4 – Average distance moved by bluefish/hour. Violet represents bluefish movements in meters west/hour; Green, tidal currents (m/sec); and blue is tidal depth (meters). Black and yellow bar above the x-axis indicate night and day, respectively. Unpooled bluefish movements were significantly correlated with tidal current velocity but not the other variables.