Download
1 / 38
380 likes | 509 Vues
This study investigates the sulfur dioxide (SO2) and carbonyl sulfide (COS) observations collected by the Michelson Interferometer for Passive Atmospheric Sounding (MIPAS) over the years 2002-2012. Utilizing limb-scan spectroscopy, the research presents monthly averaged SO2 profiles, evaluates stratospheric dynamics, and examines the impact of volcanic eruptions. Findings highlight the downwelling of SO2-rich air during polar winters and provide evidence for the role of sulfuric acid (H2SO4) in atmospheric chemistry. Comparison with ACE-FTS data underscores the reliability of MIPAS observations.

E N D
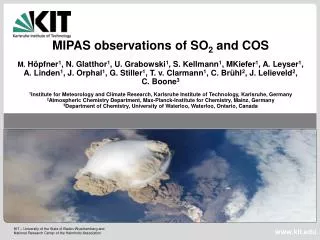
MIPAS observations of SO2and COSM. Höpfner1, N. Glatthor1, U. Grabowski1, S. Kellmann1, MKiefer1, A. Leyser1, A. Linden1, J. Orphal1, G. Stiller1, T. v. Clarmann1, C. Brühl2, J. Lelieveld2, C. Boone3 1Institute forMeteorologyandClimate Research, Karlsruhe Institute of Technology, Karlsruhe, Germany 2Atmospheric Chemistry Department, Max-Planck-Institute for Chemistry, Mainz, Germany 3Department of Chemistry, University of Waterloo, Waterloo, Ontario, Canada
Observationsof SO2by FTIR limb solar occultationspectroscopy ATMOS: Rinsland et al., 1995 ACE-FTS: Doeringer et al., 2012 July 2009
The Michelson Interferometer for Passive Atmospheric Sounding on Envisat MIPAS
Sulfur aerosol precursors from MIPAS: General retrieval strategies SO2 • Retrievalfrommeanspectra (averagesover 1 monthand 10 latitudebins) (altituderange: ~13-45 km) (Höpfner et al., ACP, in press) • fromsinglelimb-scans (altituderange: ~8-20 km) COS • fromsinglelimb-scans (altituderange: ~8-30 km)
Comparisonwith ATMOS (Rinsland et al.,1995) Pinatubo MIPAS singlemonthlymeanprofiles MIPAS mean
Comparisonwith ACE-FTS (Doeringer et al., 2012) Number of limb-scans averaged White numbers: SO2vmr [ppt]
Time seriesof SO2 from MIPAS meanspectra Latitude Volcaniceruptions Downwellingof high SO2during polar winter: reasonfor CN-bursts in spring High levelsfromphotolysisof H2SO4 Productionfrom COS Altitude [km]
Productionof SO2from H2SO4 in theupperstratosphere Model (ECHAM5-MESSy withaeroslmoduleGMXe) without H2SO4 NIR photolysis MIPAS Measurements Model with H2SO4 NIR photolysis + sulfur sink on meteoricdust Vaida et al., 2003 Mills et al., 2005 Brühl et al., ACPD, 2013
H2SO4photolysisandmeteoricdust sink 40 km Model without H2SO4 NIR photolysis Model with H2SO4 NIR photolysis Model with H2SO4 NIR photolysis + sulfur sink on meteoricdust MIPAS
Downwellingof SO2 in winteranddepletion in spring: Reasonforburstofcondensationnuclei
Downwelling in winteranddepletion in spring: Reasonforburstofcondensationnuclei Model simulation [pptv] SO2 MIPAS [pptv] H2SO4 [K] Temp Nucl. rate [cm-1 s-1]
Okmok Kasatochi Nabro Volcaniceruptions Chaiten Sarychev Merapi Pacaya Reventador SoufrièreHills Manam Rabaul Jebel al Tair Ruang
Comparisonwith ACE-FTS (500 km, 5 h) Background Volc. enhanced (>50 pptv) Volc. enhanced (>200 pptv)
Comparisonwith ACE-FTS (500 km, 5 h): Background beforeand after Jan 2005
Comparisonwith ACE-FTS and MIPAS frommonthlymeanspectra: Background Volc. enhanced (>50 pptv)
Comparisonwith in-situ observations In-situ MIPAS before Mar 2004 MPAS after Jan 2005
OCS: comparisonwith ACE-FTS Spectroscopy? MIPAS-Karlsruhe retrievals use other IR band than ACE Barkley et al., 2008 No Problem: due to tropical profiles
OCS: global distribution @ 9 km OCS: global distribution
Summary • Monthly 10° zonal mean SO2 profiles from MIPAS 2002-2012 • First observations of: • Stratospheric maximum @26-30 km • Downwelling and springtime depletion of SO2-rich air during polar winter as explanation for the springtime CN bursts • Confirmation of need for: • Visible and near-IR photolysis of H2SO4 • Irreversible sink of sulfur (meteoric dust?) • SO2 variability: • Lower stratosphere: volcanic eruptions (no indication for any larger anthropogenic influence) • 1-year: downwelling at high latitudes • ~30 km: QBO at tropics • 35-45 km: SAO at tropics+sub-tropics • Upper stratosphere: indications for solar cycle
Summary cont. • Single SO2 profiles from MIPAS 2002-2012 • Very good comparison with ACE-FTS during volcanic episodes • Signs for positive bias in background profiles (>2005) • Detailed distribution of SO2 in the lower stratosphere after volcanic eruptions • Single COS profiles from MIPAS 2002-2012 • Positive offset compared to ACE-FTS (spectroscopy?) • Good comparison with SPARC06 models