Download

1 / 22
300 likes | 1k Vues
Statistical Comparison of Immunogenicity Cutpoint Factors Using Log Transformation. Dingzhou (Dean) Li PharmaTx Statistics, Pfizer Global R&D MBSW, 2010. Definitions. Immunogenicity: Causing or capable of producing an immune response. Unwanted for target-binding drugs

E N D
Statistical Comparison of Immunogenicity Cutpoint Factors Using Log Transformation Dingzhou (Dean) Li PharmaTx Statistics, Pfizer Global R&D MBSW, 2010
Definitions • Immunogenicity: • Causing or capable of producing an immune response. • Unwanted for target-binding drugs • Desired for vaccines • Assay required for FIH • Anti-drug antibody (ADA) : • Binds to a portion of the drug thus preventing the drug from binding to its target • Affects the conformation of the drug so that when it binds to its target it is not functional. • Cross reactivity with endogenous proteins; greatest regulatory concern
Immunoassays Bridging ELISA Bridging ECL Sandwich (non- bridging ELISA) SA-HRP Biotin- labeled drug Detection Antibody/reagent:HRP ADA ADA ADA Biotin Drug Drug Drug Fab
From Quantitative to Qualitative • Quantitative • Continuous units of reference standard • Qualitative • Reference standard is not available • Ordinal or nominal • Quasi-quantitative • Continuous units of signals
Endpoint Titer: A quasi-quantitative method • A way of expressing [Ab] in blood or serum • Related to the number of times you can dilute a sample of serum and still detect Ab • Titer = Reciprocal of the last dilution of a titration giving a measurable effect. • Reported log2 of the titer.
Endpoint Titer Example RLU Titer=1894222 cutpoint
Cutpoint • Cutpoint: Positive vs. Negative • How to calculate cutpoint? • Pooled negative controls (PNC) • Cutpoint = Mean(PNC) + cα*SD(PNC) • cα : Critical value at significance level α, depending on underlying distribution (e.g. c0.05 = 1.645 for normal distribution) • Parametric or nonparametric • Screening vs. Confirmatory
Cutpoint Factor • For each plate in production, want to readily get the plate-specific cutpoint • Multiply the mean PNC by a factor • Cutpoint = Mean(PNC) * CPF • Need two steps…
Two Steps • Step 1: Cutpoint factor determination • Negative control only • Step 2 : Production • Negative control, positive control, patient samples on the same plate • Endpoint titer, inference, sensitivity, etc
Step 1: Cutpoint Factor Determination • 150 samples distributed on 6 plates • Sample: a serum sample from a subject • For each plate, • CPF (Plate) = Cutpoint (Plate)/Mean(Plate) • Average CPF for all the plates to get an overall CPF • This is the CPF for Step 2
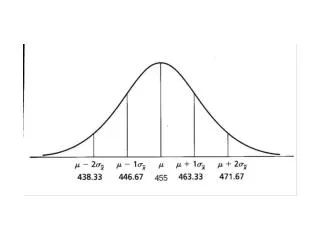
Step 1: Pooled Negative Controls cutpoint RLU
Step 2: Typical Production Plate Layout • Cutpoint = Mean(NC) * Overall CPF (from Step 1) • Use the cutpoint for endpoint titer calculation
Comparing Cutpoint Factors • Are CPFs the same at different setups? • Reagent lot, serum type, etc • Important for process improvement • Decision making • How to compare CPF with repeated measures? • A subject may contribute multiple samples
Statistical Treatment of CPF • Note for a certain plate, CPF = (Mean+ cα*SD)/Mean = 1+ cα*CV • CV has a noncentral t-distribution (Johnson and Welch, 1967) • Computationally difficult (though tools do exist) • Hard to extend to repeated measure scenarios • Alternative: Log-transform • In many cases, the signals (relative light units) are approximately log-normal
Example: 25 Samples • Goodness of fit • Normal: p = 0.02 (S-W test) • LogNormal: p = 0.10 (Kolmogorov’s D)
Log-transform Approach • It is well known that if X ~ then CV(X) = • When σ is small, • So statistical inference can be based upon variability of the logged data
Example: 25 Samples • Noncentral t-distribution • CV = (0.088, 0.157) • CPF= (1.145, 1.258) • Log-transform • CV = (0.084, 0.150) • CPF = (1.138, 1.247)
Homogeneity of Variability • Levene’s test • Fit 1st ANOVA to get residual variability estimate • Fit 2nd ANOVA on abs(residual) to test equal variance • Readily extends to repeated-measure cases • Models: • i: Lot; j: replicate; k: subject • 1st ANOVA: RLUijk = μ + replicatekj(i) +subjectk+ εijk => Get residualsrijk • 2nd ANOVA • Within-lot: rijk = μ + replicatej(i) +εijk • Between-lot: rijk = μ + loti +εijk
Example • Two different reagent lots • Three plates at each lot • Samples from 30 subjects • Results: • In Lot 1, Plate a2 has higher variability than other plates • No significant difference in variability between Lots 1 and 2
Discussions • Cutpoint analysis is crucial in various applications of the endpoint titer method • Cutpoint in most cases depends on the plate, experimental parameters, etc. So using a fixed cutpoint is not recommended • Uncertainty in CPF will translate to error in the endpoint titer
Acknowledgements • Daniel Baltrukonis – Immunotox CoE • Jessica Duffy – Immunotox CoE • David Potter – PharmaTx Statistics