Download
1 / 63
630 likes | 859 Vues
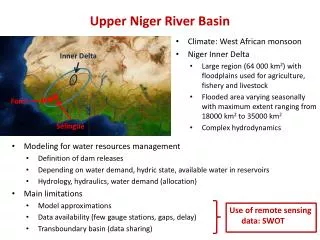
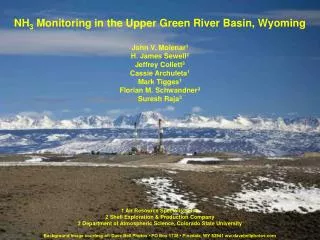
Ozone in Winter in the Upper Green River Basin. Greater Yellowstone Area Clean Air Partnership Meeting October 15, 2008. Jonah/Pinedale 2005. Sublette County Wells. Sublette Co. Gas Production 1980-2007. How Ozone is Formed.

E N D
Ozone in Winter in the Upper Green River Basin Greater Yellowstone Area Clean Air Partnership Meeting October 15, 2008
How Ozone is Formed • Formed through a complex series of reactions between nitrogen oxides and volatile organic compounds driven by sunlight. • Generally thought to occur under sunny, high temperature situations (i.e., summer months in urban areas)
Changes to 8-hr Ozone National Ambient Air Quality Standard • Previous Standard: 3-year average of the 4th highest daily 8-hour averaged ozone concentration = 0.08 ppm • Standard Revised in May 2008: 3-year average of the 4th highest daily 8-hour averaged ozone concentration = 0.075 ppm • The primary (health-based) and secondary (welfare-based) standard were set at the same value
History of Air Monitoring in the Upper Green River Basin • Began ozone monitoring in 2005 • Standard was 0.08 (~0.084) • Found elevated levels: • 4th high 8-hour 0.080 on February 24th • (Yellowstone monitor that day was 0.049) • Confirmed that monitor was functioning properly • Recurred in 2006 • 4th high 8-hour 0.075 on February 27th • (Yellowstone monitor that day was 0.056)
2005 & 2006 Top 5 8-hour ozone concentrations * Less than 75% data completeness $ Began operation in July 2005
Theories on Causes • Monitoring error • Stratospheric Intrusion • Transport • Locally Formed Jonah 12:00 2/27/06
Theories on Causes - conclusions • Monitoring error: Not Likely • Checked certifications • Additional 3rd party audits • Elevated concentrations at multiple monitors • Winter 2006 put Chemiluminescent ozone monitor at Jonah to check for interference and found none • Stratospheric Intrusion:Not Likely • Tight inversion and stagnant conditions for several days • Transport: Slight Possibility • Other areas had not reported high wintertime conditions
Theories on Causes (cont.) 2005 • Locally Formed: Most Likely • Precursors emitted in area • Suspected tight inversion • Stagnant conditions • Sunny, snow cover
AQD Response to Ozone Events • Concerns about elevated concentrations • Potential for NAAQS violation • Health effects on local public • More development planned in SW Wyoming • Requested proposals for an Ambient and Meteorological Field Study
AQD Initiated an Intensive Field Study in Jan. 2007 • Study Objectives: • Determine meteorological conditions • Identify causes of high ozone • Identify ozone distribution • Identify role of ozone precursors • Develop tools to model ozone formation
2007 Continuous Measurements • Continued monitoring at Boulder, Jonah, and Daniel South • CastNet continued collecting ozone data • Wind speed with height at airport • Seven temporary stations to measure wind speed, wind direction and ozone
2007 Intensive Operating Periods (IOPs) • Operational forecasts • Elevated ozone events likely • Trigger Intensive Operating Periods (IOPs) • IOP Measurement Objectives • Determine structure of atmosphere during high ozone events: • How shallow is the inversion? • What does the vertical ozone profile look like? • What differences exist between Jonah, Boulder, Daniel? • Determine spatial variability of ozone concentrations around Upper Green River Basin • Determine VOC concentrations
2007 IOP Measurements • Temporary equipment to measure upper level winds, temp., relative humidity and ozone at Airport • Aircraft measurements of ozone, temp., VOCs
Summary: 2007 vs. 2005-2006 Weather Patterns • Weather conditions associated with high ozone events in 2005-2006 did not occur during 2007 • Lack of snow cover in 2007 • Stronger upper level winds in study area in 2007 • Stronger surface winds in 2007 • Morning surface inversions did not persist
Meteorology • Why important? • Ozone a secondary pollutant • Ultraviolet light (sunshine) • Temperature inversion
Ozone: Sunlight • UV energy from the sun is required to produce ozone • Historically, scientists believed ozone can’t be formed in low temperatures or areas with low sun angles (i.e., winter) • Study measured UV energy • Result: when ground is highly reflective, UV energy is doubled
Ozone: Sunlight Albedo = 0.81 (snow) Albedo = 0.04 (bare ground)
Preliminary conclusions • In the winter: • Temperature inversion • Still air • Snow cover • Sunshine • Ozone precursors present in UGRB Produce elevated ozone
2008 Field Study Objectives • Develop a more complete characterization of winter ozone events in the Upper Green River Basin • Provide data for • Development of a conceptual model of ozone formation • More accurate numerical simulations of high ozone events
2008 Study Approach • Study design based on 2005 & 2006 high ozone event data • Identify meteorological and air quality modeling data requirements • Identify data needed to evaluate initial theories • Develop episode forecasting protocol • Use field study website to post daily forecasts and raw data • Conduct measurements: mid-January – March 2008 • Continuous Measurements to supplement existing network • Intensive Operating Periods (IOPs)
2008 UGWOS Continuous Sampling • Routine data collection at existing sites (Boulder, Jonah, Daniel South, Pinedale-CASTNET) • Airport operations • Surface ozone • Surface winds • Sodar Site • Upper level winds, temp • Detected inversions • Five temporary surface sites • Wind speed, wind direction and ozone
2008 UGWOS IOP Measurements • Inversion layer measurement and columnar ozone measurement at airport: 8:00, 11:00, 13:00, 17:00 • VOC/Carbon compounds sampling • Three hour integrated samples at Jonah, Boulder, Daniel: 4:00 – 7:00, 9:00 – 12:00, 14:00 – 17:00 MST • Aircraft grab samples • Aircraft • Morning and afternoon flights • Ozone, PM2.5, Temperature, Pressure
140 UGWOS Area Max Thunder Basin 120 Campbell Co. Centennial Yellowstone 100 80 75 ppb ppb 60 40 20 0 115 118 121 124 127 130 202 205 208 211 214 217 220 223 226 229 303 306 309 312 315 318 321 324 327 330 Month/Day (MDD) Wyoming Daily Max 8-Hr O3: 2008 UGWOS Study Period
85 75 Compliments of Shell 2008
85 75 Compliments of Shell 2008
2008 Pinedale Airport Vertical Profiles 11 March @ 6:00 pm 12 March @ 4:00 pm Temp O3 No Inversion, no elevated O3 Different wind directions above and below inversion Inversion at 100 m Elevated O3 below inversion Raw data – subject to change
Role of Mixing Heights SODAR Mixing Height Daily Max 8-Hr Avg O3 at Boulder • Elevated O3 when MH < 150 m agl • Note mini-SODAR max range = 250 m agl
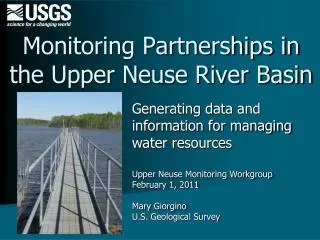
Photos from Boulder Visibility Camera Feb. 19, 2008 Feb. 19, 2007
Typical characteristics of high ozone episodes • Extensive snow cover, light winds, clear to partly cloudy skies • Strong, surface based inversion • Precursors trapped in very shallow layer (less than about 150 m) • High morning NOx and VOC • Limited horizontal mixing results in strong spatial gradients • Morning NW to afternoon SE wind reversal • Most common at Jonah; also seen at other sites • Highest ozone nearly always found at Boulder; lowest at Daniel and Cora in 2008
Conditions Conducive to Ozone Formation • The Three S’s: • Surface winds are light • Snow cover is fairly complete • Skies are clear to partly cloudy • And more S’s: • Stable shallow surface layer with strong surface inversion
What’s being done to reduce emissions associated with oil and gas exploration and production?
Ozone Precursor Sources • Drill rigs • Venting and Flaring from Well completion activities • Gas production • Vehicles
Emission controls: Rig Engines • State has no authority to regulate “non-road” sources • BLM’s Jonah Infill Record of Decision enabled NOx reductions improvements to rig – natural gas engines • BLM’s Pinedale Anticline Record of Decision requires operators to drastically reduce NOx emissions
Insulated Urea storage tank used w/SCR to control NOx emissions from the diesel generators. Urea Tank
Cat 3512 (~1500 HP each) Diesel Generator Stacks w/SCR Note: Typically all 3 generators operate only during the drilling of the first 2,500 feet of each well with 2 generators operating for the rest of the drilling.
Ozone Precursor Sources that DEQ Controls • Gas production