Download
1 / 34
340 likes | 553 Vues
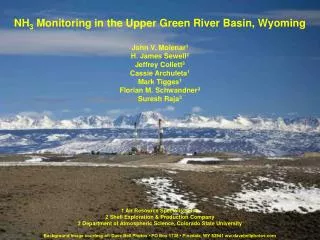
NH 3 Monitoring in the Upper Green River Basin, Wyoming. John V. Molenar 1 H. James Sewell 2 Jeffrey Collett 3 Cassie Archuleta 1 Mark Tigges 1 Florian M. Schwandner 3 Suresh Raja 3 1 Air Resource Specialists, Inc 2 Shell Exploration & Production Company

E N D
NH3 Monitoring in the Upper Green River Basin, Wyoming John V. Molenar1 H. James Sewell2 Jeffrey Collett3 Cassie Archuleta1 Mark Tigges1 Florian M. Schwandner3 Suresh Raja3 1 Air Resource Specialists, Inc 2 Shell Exploration & Production Company 3 Department of Atmospheric Science, Colorado State University Background image courtesy of: Dave Bell Photos • PO Box 1738 • Pinedale, WY 82941 ww.davebellphotos.com
Background: oil & gas development in Upper Green River Basin • Monitoring & Laboratory Procedures • Results & Interpretation
Upper Green River Valley Nestled between the high peaks of western Wyoming's Wind River, Gros Ventre and Wyoming Ranges, the valley is home to: More than 100,000 big game animals Largest mule deer herd in U.S. Continental America's longest big game migration route and a crucial link to the Greater Yellowstone Ecosystem (GYE) Largest publicly-owned big game winter range in the GYE One of the west's last best sage grouse habitats and a world-class fishery One of the largest natural gas reserves in the U.S.
Oil & Gas Emissions Particulates – roads & disturbed land VOCs – drilling fluids, separation, dehydration, produced water, gas venting, gas compression NOx – diesel drilling rigs, gas compression, vehicles, flaring
WRAP BART CALPUFF Modeling The Interagency Workgroup on Air Quality Modeling (IWAQM, 1998) recommends three background values for CALPUFF modeling: 0.5 ppb for forested lands; 1.0 ppb for arid lands; and 10 ppb for grasslands. Most of the western U.S. Class I areas are characterized by arid and forested lands, consequently a 1.0 ppb background ammonia value was selected for the WRAP RMC BART CALPUFF modeling.
WRAP BART CALPUFF Modeling The complex non-linear sulfate-nitrate-ammonia system is highly dependent on availability of ammonia - NH3(g) SO2(g) ↔ H2SO4(g) NH3(g)+ H2SO4(g) ↔ (NH4)2SO4(p) NO2(g) ↔ HNO3(g) NH3(g) + HNO3(g) ↔ NH4NO3(p)
Objectives of the Upper Green River Basin Ammonia Air Monitoring Project • measure background ammonia (NH3) concentration for one year for use in refined visibility analyses • measure concentrations of other related gases and particles to provide information about the local nitrogen budget • attempt to identify the source regions attributable to these gases and particulates.
Monitoring Constraints • sample at existing monitoring site • desire to use well known and accepted sampling and analysis protocols • a priori assumption that NH3 would be at low concentrations • cost
Monitoring: Instrumentation • URG dual annular denuder system (Model 3000CA), mounted at a sample height of 1.5 meters • A dual channel URG denuder/filter pack sampler is used to collect samples of ambient trace gas (ammonia, nitric acid, and nitrate) and PM2.5 aerosol species (ammonium, nitrate, and sulfate) • The prepared denuder/filter pack set is shipped to the site operator on a weekly basis, who installs it into the URG sampler according to a defined twice-weekly schedule that results in alternating 3-day and 4-day integrated samples • The spent denuder/filter pack is shipped to the atmospheric science laboratory at CSU.
Air Quality Station Flow Recorders Air Temperature Ammonia Sampler Controller and MFC Temperature-Controlled Housing for Denuders and Filters PM2.5 Size-Selective Inlets Controller Housing Shipping Case
Laboratory Analyses • The denuders are extracted immediately upon arrival at CSU and the extracts are refrigerated until further analysis • The filters are also unloaded immediately and stored frozen until extraction and analysis • Samples are analyzed by ion chromatography on a monthly basis • Data is validated according to EPA protocols and consist of concentrations in μg/m3 and ppbv for gases
Neutralization • Convert mass to molar values • Ratio [NH4+] / [NO3-] + 2[SO42+] • Then: ratio = 1 fully neutralized ratio < 1 acidic < 0.5 very acidic ratio > 1 excess NH4+
Residence Time Analysis • Ammonia weighted back trajectories were used to identify the geographic source areas most likely to contribute to the highest measured ammonia days. • Trajectories were generated using the Hybrid-Single Particle Lagrangian Integrated Trajectory (HYSPLIT) model developed by the National Oceanic and Atmospheric Administration’s (NOAA) Air Resources Laboratory (ARL). Detailed information regarding the trajectory model and these data sets can be found on NOAA’s Web site (http://www.arl.noaa.gov/ready/hysplit4.html). • Three back trajectories were generated per day, including end times of 0400, 1200 and 2000 MST and end heights of 100 m. Each hourly point along a 72-hour back trajectory paths was weighted with measured ammonia concentration corresponding to the end date of each trajectory. The ammonia values associated with each hourly point were then summed and normalized into 1/4 degree horizontal grid cells of latitude and longitude.
Conclusions • NH3 concentrations are highly seasonally dependent. Ranging from near detectable limits Dec-Feb, to peak values of 1.5 ppb during the summer. • 2007 average NH3 was 0.24 ppb • Residence time analysis indicates that NH3 is transported into the region primarily from the west along the Snake River Valley and Southwest along the Wasatch front.