Download
1 / 23
230 likes | 342 Vues
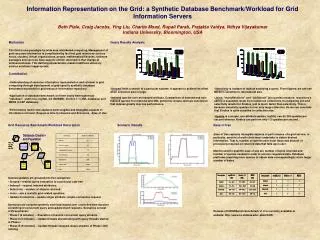
Explore the IEE Offshore Grid Project involving techno-economic analysis of wind power scenarios & time series results. Findings on European power market modeling.

E N D
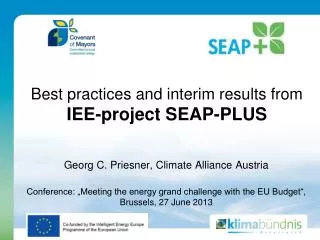
IEE OffshoreGridScenario Definitions and First Iteration Results Jan De Decker, 3EJens Tambke, ForWind Warsaw, April 22, 2010
Outline The IEE Study OffshoreGrid Input definitions and scenarios First results (Wind Power Time Series) Next steps Conclusions 2
IEE OffshoreGrid PROJECT DNA Techno-economicstudy Cost-benefitanalysis of different design options Budget 1.4 M€, 75% funded by EC Coordinator 3E, 8 partners, consultancy & appliedresearch APPROACH PREPARATION Scenarios 2020 / 2030 (offshore & onshorewind, onshorereinforcements, energyeconomics, regulatoryframework…) MODELING Cost optimisation of infrastructure European power market model 3
IEE OffshoreGrid – Timing & High-level Milestones 2nd Stakeholder WorkshopDraft results discussed with EC DG TREN Wind farms, energy economics, 1st Stakeholder workshop Techno-economic modelling closed Transfer to Mediterranean region Preparation phase closed Finalresults Project start Sep ‘09 Jan ‘10 Jul ‘10 Jan ‘11 Jul ‘11 Oct ‘11 May ‘09 4
Input definitions and scenarios Economical and regulatory model inputs Analysis of design drivers Offshore & onshore wind power scenarios Analysis of other marine developments Deliverables to be found on www.OffshoreGrid.eu 5
Input scenarios Onshore and offshore wind scenarios for 2020 and 2030 [MW] • Onshore: 196602 • Offshore: 43093 • Total: 239695 • Onshore: 267047 • Offshore: 125787 • Total: 392824 6
First results:Wind Power Time Series [m/s] Weather Model (WRF): 2-domain-setup: • 1st domain resolution: 27x27 km² • 2nd domain resolution: 9x9 km² • Example results WRF model: • 90m annual mean wind speeds (2007) • Power production of Danish 200 MW wind farm 8
First results:Wind Power Time Series Total European On&Offshore Power 2030 [GW] Hour of the Year [h] 267 GW inst. onshore, mean production: 64 GW 127 GW inst. offshore, mean production: 60 GW 9
First results:Wind Power Time Series Extract - European On&Offshore Power 2030 Much correlation between onshore and offshore wind power Power [GW] 8th-28th March 2030 Hour of the Year 10
First results:Wind Power Time Series Maximum downward variations [% of Pinst] • Impact of aggregation (via offshore grid) is very positive
First results:Wind Power Time Series Correlation coefficients between countries (on- & offshore) [%] Apart from Hydropower in Norway, especially horizontal interconnection is interesting for balancing and to reduce total variability
Next phase: Modeling WP5: • Provide the technical design for an integrated offshore transmission network • Provide a cost estimate for such a network or networks WP6: • Model = Flow based power market simulator (cf. TradeWind) • Study different options regarding offshore grid design, market conditions and regulatory framework • Assess various technical and economic impacts 13
Modeling: Methodology Prototype grids Compare costs & benefits of different designs: Base case Trade driven design Offshore wind driven design Mixed design 14
Prototype grid designs – Base case • Existing interconnectors & Planned interconnectors (decided+under construction)
Modeling: Methodology Case studies Start with case studies: • Quicker valuable results for EC • Get deeper understanding of economics with double use • Case study Dogger Bank • Evaluate findings in 2nd case study (probably UK-BE-NL) 21
Conclusions IEE OFFSHORE GRID techno-economic study & policy framework scientific view on offshore grids (with cost-benefit) FIRST RESULTS Wind Power Scenarios Analysis of Wind Power Time Series Other deliverables to be found on www.OffshoreGrid.eu FINISHED BY JULY 2010 Modeling of case studies + first evaluation cost & benefits 22
Thank you for your attention!www.offshoregrid.euJan De Decker Jan.DeDecker@3e.euwww.3E.euVISIT US AT STAND 4328