Download
1 / 28
280 likes | 574 Vues
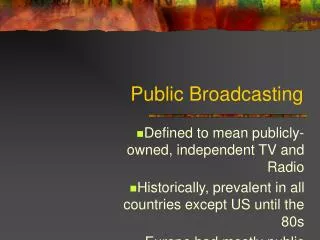
ECONOMIC OUTLOOK: IMPACT ON PUBLIC BROADCASTING. Board Presentation January 26, 2009. Uncharted Territory. Ships of Christopher Columbus at sea. N.C. Wyeth, 1927. [Source: Library of Congress]. Agenda. Media Landscape Station Data Potential Impact Outcomes. Media Landscape.

E N D
ECONOMIC OUTLOOK: IMPACT ON PUBLIC BROADCASTING Board Presentation January 26, 2009
Uncharted Territory Ships of Christopher Columbus at sea. N.C. Wyeth, 1927. [Source: Library of Congress]
Agenda • Media Landscape • Station Data • Potential Impact • Outcomes
Total public radio audience at all-time high Public Radio Cume Trend 1997-2008 28,744,600 97 98 99 00 01 02 03 04 05 06 07 08 Source: Audience Research Analysis, Inc. and Arbitron
The decline in PTV ratings and OTA only households have similar trends PBS Prime Time Ratings vs. % OTA only Households PBS PT Rating % OTA only HH PBS Prime Time Ratings % OTA only Households Source: Nielsen, Knowledge Network
More people watch cable programming and fewer watch broadcast TV programming each year Cable Network Share of Primetime TV Households Broadcast Network Source: Nielsen *compounded annual growth rate
The percent of OTA only households was nearly cut in half between 2000 and 2008 OTA Only HH % of TV households that are cable/satellite subscribers or OTA only Cable/Sat Subscribers Source: Nielsen, Knowledge Network *compounded annual growth rate
New technologies are emerging but radio remains strong Millions Used this month # users each week # of subscribers Have listened # of radios Source: Edison Media Research 2008, Orbitcast, Bridge Ratings, Arbitron
Watching TV at home is still predominant platform for viewing Number of hours spent viewing TV/video per user Source: Nielsen
Expected Downturn in Commercial Advertising Revenue in 2009 • Newspaper down 17% • Magazine down 15% • Radio down 13% • Broadcast TV networks down 10% • Cable networks down 3% • Internet up 6.1% (down from 16% over previous 5 years) Source: Barclays Capital
PBS prime time national underwriting flat but major PBS series underwriting down $86.2 $87.0 Total PBS Prime Time Programming Millions $32.5 $18.8 Major PBS Prime Time Series Source: PBS
Public radio station-generated underwriting has been consistently trending upwards Millions Source: AFR
National sponsorship relies on several hard-hit sectors PBS program funding by sector, FY2008* Source: PBS * General Audiences Programming
NPR Sponsorship Revenue by Major Category FY2008 Financial, 43% All Other, 43% Media (Movies, Books, Music, TV, etc.), 20% Automotive, 10% Source: NPR
PTV Financial Assessment Goals • To identify public television licensees affected by economic downturn • To determine common causes and trends
PTV Financial Assessment Process • Analyzed financial risk factors: • Current Ratio • Debt Ratio • Operating Results Ratio • Utilized 2007 & 2008 audited financial data
PTV Financial Assessment Findings Good Moderate Fragile $0-$5 $5-$10 $10-$25 Over $25 Total Station Revenue in Millions
PTV Key Non-Federal Support • Membership • State • Underwriting
Public Radio Revenue Under Stress • Radio not immune to economic downturn • Underwriting down • National level • Local level • Membership flat or down • State & University licensees support down • Endowment & investment revenue down
Potential Revenue Declines Potential 16% decline in Public TV revenue for FY09($292 M) Potential 13% decline in Public Radio revenue for FY09($126 M) Potential total revenue decline of $418 M for FY09
Potential TV Revenue Declines $ In Millions *Projected revenue Source: AFR
Potential Radio Revenue Declines $ In Millions *Projected revenue Source: AFR
Potential Impact • Service reduction • Budget tightening • staff reductions &/or hiring freezes • cut/reduce local programs • cut some national programs • Regional station networks under stress • fuel/fixed costs (transmitter/tower leases, utilities, interconnection & maintenance) • A few small to mid-sized institutional licensees decide to stop station subsidy • sell or outsource station (LMA; merger) • National organizations • Associations
Public Service Outcomes • Preserve universal service • Less overhead & infrastructure where possible • Support operational efficiencies • Promote greater efficiency thru combined operations • Combined backend, engineering, membership, on-line • Preserve public service spectrum • Where existing licensee goes dark • Promote diverse services in multi-station markets • Promote a higher level of use, greater diversity of service