Download
1 / 23
230 likes | 339 Vues
Learn to calculate Mean Absolute Deviation, interpret graphs, and discuss data distribution using dot plots, histograms, and box plots.

E N D
Welcome to Math 6 Statistics: Mean of Absolute Deviation
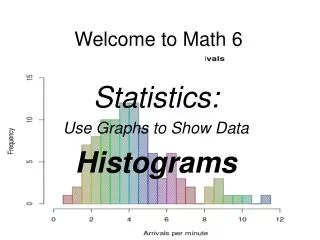
Objectives • Interpret graphs that show the shape of a distribution of data. • Discuss the center, spread and overall shape with dot plots, histograms and box plots.
Connector You have used the interquartile range which describes the variability of a set of data. Another way to describe the variability of a set of data is to use its mean absolute deviation. The mean absolute deviation of a set of data is the average distance between each data value and the mean.
How to Calculate Mean Absolute Deviation The mean absolute deviation is an average of how far each data point in a set is from the mean of the set of data. In other words, it is the “average distance from the average.”
Example Problem The weights of three students are 56 pounds, 78 pounds, and 91 pounds. What is the mean absolute deviation in weights?
How to CalculateMean Absolute Deviation Step 1: Find the mean of the set of data. In the example problem, students add up the weights and then divide by 3 to find the mean. (56 + 78 + 91) ÷ 3 = 75
How to Calculate Mean Absolute Deviation Step 2: Determine the deviation or difference of each number in the data set from the mean. The mean of the example problem is 75. Subtract 75 from each number in the data set to find the difference. 56 – 75 = -19 78 – 75 = 3 91 – 75 = 16
How to Calculate Mean Absolute Deviation Step 3: Find the absolute value of each deviation from Step 2. I -19 I = 19 I 3 I = 3 I16 I = 16
How to Calculate Mean Absolute Deviation Step 4: Find the average of the absolute deviations from Step 3. (19 + 3 + 16) ÷ 3 = 12.67 Answer: 12.67 is the mean absolute deviation.
Example Problem The weights of three students are 56 pounds, 78 pounds, and 91 pounds. What is the mean absolute deviation in weights? By calculating the mean absolute deviation, we can say that each person weighs an average of 12.67 pounds more or less than the mean of 75 pounds.
Key Vocabulary • Box plot(box and whisker graph) • A graph that shows how far apart and how evenly data are distributed.
Guided Practice 1 The table shows the number of contacts eight friends have stored in each of their cell phones. Find the mean of the data.
Guided Practice 1 What is the difference between the data value 52 and the mean?
Guided Practice 1 Which value is farthest from the mean?
Guided Practice 1 Overall, are the data values close to the mean or far away from the mean? Explain
Mean Absolute Deviation • The mean absolute deviation of a set of data is the average distance between each data value and the mean. • 1. Find the mean. • 2. Find the distance between each data value and the mean. • (That is, find the absolute value of the difference between each data value and the mean.) • 3.Find the average of those differences.
Guided Practice 2 The table shows the maximum flying speeds of the ten fastest birds worldwide. Find the mean absolute deviation of the set of data. Round to the nearest hundredth.
Guided Practice 2 Describe what the mean of absolute deviation represents.
Box (and Whisker) Plot Box plot visually displays a distribution of data values by using the median, quartiles, and extremesof the data set. The box shows the middle 50% of the data and the extended “whiskers” show the remaining 50% of the data.
Key Vocabulary Variability- is another characteristic of a data set. It also known as the ‘spread’ of the values. http://www.mathebook.net/dict/sdict/spread.htm
CONCLUSION The mean absolute deviation of a set of data is the average distance between each data value and the mean. Find the mean. 2. Find the distance between each data value and the mean. That is, find the absolute value of the difference between each data value and the mean. 3.Find the average of those differences.
Assignments Complete additional problems on the homework page “Finding Mean Absolute Deviation.” Search the internet for any remaining terms from the upcoming vocabularyslide. Write down a definition of the terms that makes sense to you.
box plots, dot plots, histograms, frequency tables, cluster, peak, gap, mean, median, interquartile range, measures of center, measures of variability, data, Mean Absolute Deviation (M.A.D.), quartiles, lower quartile (1st quartile or Q1), upper quartile (3rd quartile or Q3), symmetrical, skewed, summary statistics, outlier