Statistics Review for Math 6 Students
Learn measures of center, spread, and shape with dot plots, histograms, and box plots. Explore central tendency and variability using mean, median, range, and interquartile range. Interpret data distribution graphs effectively.

Statistics Review for Math 6 Students
E N D
Presentation Transcript
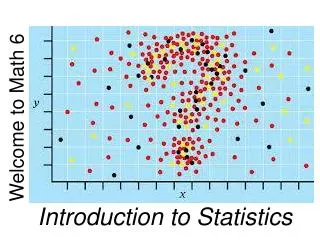
Welcome to Math 6 Statistics Review
Math 6 Statistics Objectives • 1-Discuss the center, spread and overall shape with dot plots, histograms and box plots. • 2-Use measures of center: • a-Find the mean of a set of data. • b-Find the median of a set of data.
Math 6 Statistics Objectives 3-Use measures of variability a-Range b-Interquartile range c-Mean absolute deviation 4-Interpret graphs that show the shape of the distribution of the data.
Students spent the following amounts of money on textbooks for one semester. $101, $107, $121, $90, $89, $101, $98, $110, $115, $85, $95, $109, $109, $110, $109 Complete the frequency table.
2nd: Make a dot plot to represent the data. Display numerical data in plots on a number line, including dot plots.
Measures of Central Tendency Find the median of the data.
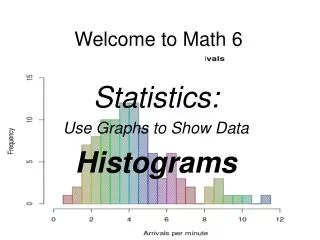
Draw the frequency histogram Display numerical data in plots on a number line, including histograms.
Describe the skew of the data Money Spent On Books for One Semester
Make a Box Plot to present the data Display numerical data in plots on a number line, including box plots.
Measures of Variability What is the range and the interquartile range?
Measures of Central Tendency What is the mean of the data?
Measures of Variability What is the mean absolute deviation
Conclusion CCSS.Math.Content.6.SP.A.1 Recognize a statistical question as one that anticipates variability in the data related to the question and accounts for it in the answers.
Conclusion CCSS.Math.Content.6.SP.A.2 Understand that a set of data collected to answer a statistical question has a distribution which can be described by its center, spread, and overall shape.
Conclusion CCSS.Math.Content.6.SP.A.3 Recognize that a measure of center for a numerical data set summarizes all of its values with a single number, while a measure of variation describes how its values vary with a single number.
Assignments Statistics Assessment