Download
1 / 11
110 likes | 256 Vues
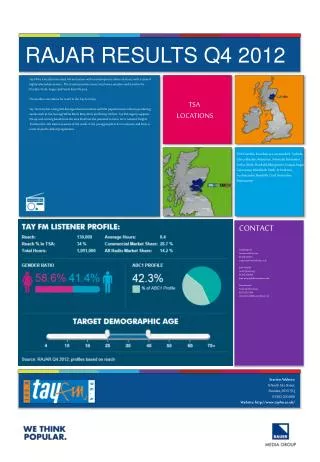
2012 Results. Offices across the world Research in 60+ countries, 140+ people, 200+ clients. Amsterdam. London. Hamburg. Los Angeles. Paris. Lausanne. Milan. New York. Chicago. Austin. Shanghai. New Delhi. Mumbai. Singapore. Sao Paulo. Melbourne (licence partner).

E N D
Offices across the world Research in 60+ countries, 140+ people, 200+ clients Amsterdam London Hamburg Los Angeles Paris Lausanne Milan New York Chicago Austin Shanghai New Delhi Mumbai Singapore Sao Paulo Melbourne (licence partner) = Current Office = Opening Office = Undertaken research
2012 performance Revenue (£m) Nov - Dec Until October, heading for another year of revenue and profit growth Jan - Oct • But: didn’t have as big an end of year as usual • November revenue down 20% vs 2011 • December revenue down 29% vs 2011 Operating Profit (£m) Ended the year with flat revenue Overheads up 9%, operating profit down 45% PAT and EPS down similarly to £1.0m and 7.9p respectively Final dividend maintained – 3% up for the year
Underlying causes Clients spent less unused y/e budgets than usual • Prolonged difficult economic backdrop caught up with us High operating leverage • Small differences in revenue and cost growth have big impact on profit Cost growth out of synch with revenue growth • In part due to limited revenue visibility • In part due to continued investment for long term growth Haven’t yet won meaningful mandates • As a creative consultancy, scale is hard to achieve without them Monthly revenue (£m)
Cash flow Cash conversion 84% 78%
Fundamentals unchanged • Long term growth still dependent on: • take up of Juicy products and mandates • ability to scale business • Revenue from Juicy products up 22% • Double digit revenue growth in 11 of top 20 clients, single digit growth in another 2 • 5 tenders for mandate (or similar) – won 1 • Until Q4 underlying metrics positive
2013 outlook • Reduced headcount in December 2012 to keep 2013 % cost growth to low single digits • Continue to invest in new offices in China, Brazil and India • Reframing service offerings within behavioural science model • Refining and unifying our product portfolio • Dedicating senior people to identifying and responding to mandate type opportunities • Promising start to 2013 ….. but as always limited revenue visibility for the full year
The challenge Market research as we know it will be dead by 2020 Kim DedekerP&G Global Head of MR We need more magic and less logic Marc Mathieu, Unilever CMO We’re drowning in data but thirsting for insight Denise Drummond-Dunn Nestle Global Head of MR How do we change from a “Plan-Learn-Qualify-Optimise-Launch-Track-Revisit in a year” research approach, to a more agile, real time “Do-Learn” mentality Joan Lewis Global Consumer &Market Knowledge Officer, P&G
Behavioural model ENVIRONMENTAL SOCIAL See Share Copy Sense Choose Act JuicyBrains Community DigiViduals Predictive Markets Behavioural Audit Behaviour Interventions System 1Pack Test DECISION Feel Do Think SpringSights Validator Concept Optimizer ComMotion PERSONAL
Turning human understanding into business advantageJohn Kearon, Chief Juicer