Download

1 / 18
180 likes | 337 Vues
Confidence Interval for a population mean. Section 10.1. Things to remember:. Proportions : Means : np ≥ 10 normal if n(1 – p) ≥ 10 population is; CLT Population ≥ 10*n. To check for Normal approx.: To check for Independence:.

E N D
Confidence Interval for a population mean Section 10.1
Things to remember: Proportions: Means: np ≥ 10 normal if n(1 – p) ≥ 10 population is; CLT Population ≥ 10*n To check for Normal approx.: To check for Independence:
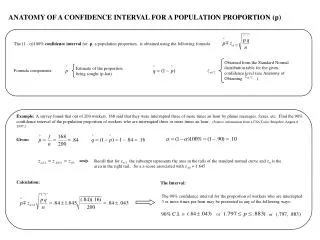
Conditions for constructing a confidence interval The construction of a confidence interval : • Data come from an SRS from the population of interest • Observations are independent. • The sampling distribution is approximately normal
Constructing a Confidence Interval Estimate ± margin of error Estimate ± (critical value)(std. dev. of statistic) (statistic)
Critical Value • Depends on: • The confidence level (ex. 95% confident) • The sampling distribution
Critical Value z* • The number z* with probability p lying to its right under the standard normal curve is called the upper p critical value of the standard normal distribution.
Example 10.4, pg. 544Finding z* • If we want to find the 80% confidence interval…
What is the area just under A? • .9000 Look this up in Table A!!!! A
What is the area just under A? • .9000 Look this up in Table A!!!! z* = 1.28 A
To construct a Confidence Interval: • State– know what parameters we’re estimating & at what confidence level • Plan – choose method & check conditions • Do – if conditions are met, perform calculations • Conclude – interpret the interval in the context of the problem
Example 10.5, p. 546 A manufacturer of high-resolution video terminals must control the tension on the mesh of fine wires that lies behind the surface of the viewing screen. To much tension will tear the mesh and too little will allow wrinkles. The tension is measured by an electrical device with output readings in millivolts (mV). Some variation is inherent in the production process. Careful study has shown that when the process is operating properly, the standard deviation of the tension readings is mV, and suggests the tension readings of screens produced on a single day follow a normal distribution quite closely. Here are the tension readings from an SRS of 20 screens from a single day’s production. Construct a 90% confidence interval for the mean tension µ of all the screens produced on this day.
A manufacturer of high-resolution video terminals must control the tension on the mesh of fine wires that lies behind the surface of the viewing screen. To much tension will tear the mesh and too little will allow wrinkles. The tension is measured by an electrical device with output readings in millivolts (mV). Some variation is inherent in the production process. Careful study has shown that when the process is operating properly, the standard deviation of the tension readings is mV, and suggests the tension readings of screens produced on a single day follow a normal distribution quite closely. Here are the tension readings from an SRS of 20 screens from a single day’s production. Construct a 90% confidence interval for the mean tension µ of all the screens produced on this day. • State: know what parameters we’re estimating & at what confidence level • Population of interest: All of the video terminals produced on the day in question. • Parameter we’re drawing conclusion about: Want to estimate µ, the mean tension for all of these screens.
A manufacturer of high-resolution video terminals must control the tension on the mesh of fine wires that lies behind the surface of the viewing screen. To much tension will tear the mesh and too little will allow wrinkles. The tension is measured by an electrical device with output readings in millivolts (mV). Some variation is inherent in the production process. Careful study has shown that when the process is operating properly, the standard deviation of the tension readings is mV, and suggests the tension readings of screens produced on a single day follow a normal distribution quite closely. Here are the tension readings from an SRS of 20 screens from a single day’s production. Construct a 90% confidence interval for the mean tension µ of all the screens produced on this day. • Plan – choose method & check conditions • Inference procedure: mean • Verify conditions: • SRS from population of interest? • Sampling distribution of approximately normal? • Independent? Yes! Yes! Yes!
Construct a 90% confidence interval for the mean tension µ of all the screens produced on this day. • Do – if conditions are met, perform calculations Find Use the confidence interval formula For 90% confidence level, the critical value is The 90% confidence interval for µ is: mV
Construct a 90% confidence interval for the mean tension µ of all the screens produced on this day. • Conclude – interpret the interval in the context of the problem We are 90% confident that the true mean tension in the entire batch of video terminals produced that day is between 290.5 and 322.1 mV.
Confidence Level for a Population Mean µ Choose an SRS of size n from a population having unknown mean µ and known standard deviation . A level C confidence interval for is Here z* is the value with area C between –z* and z* under the standard normal curve. This interval is exact when the population distribution is normal and is approximately correct for large n in other cases.
Homework • P. 548: 10.5, 10.7 b • Due: Wednesday