Download

1 / 19
190 likes | 221 Vues
Calculate confidence intervals when population standard deviation is unknown using t-distribution. Understand degrees of freedom and how to find sample size.

E N D
Confidence Interval of the Mean – Population St. Dev Unknown T Interval
Objective Construct a confidence interval with a population standard deviation NOT known and Find Sample Size.
Relevance Can Estimate Population Parameters from Sample Statistics
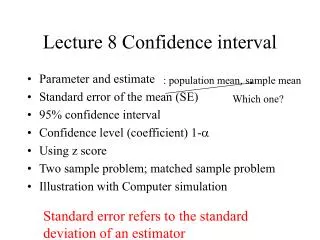
T Distributions…… • Many times the population standard deviation is NOT known and the sample size is LESS THAN 30. Then, you must use a t-distribution.
Characteristics of t…… • t distributions have the same characteristics as z’s except that they are based on degrees of freedom.
Values that are free to vary after a sample statistic has been computed. df = n - 1 Example: The mean of 5 #’s is 10 –- 4 of the 5 #’s are free to vary BUT the 5th number must be a specific value in order to get a sum of 50. df = 5-1=4 Degrees of Freedom
Find for a 95% confidence level when n=22. df = n – 1 df = 22 – 1 = 21 in calc: invT(.025,21) Read Practice…..
Find for a 99% confidence and a sample size of 14. df = n – 1 df = 14 – 1 = 13 -in calculator: invT(.005, 13). You Try
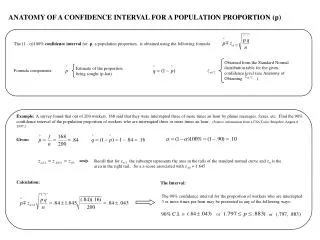
Example…… • Ten randomly selected cars were stopped and tread depth of the right front tire was measured. The mean was 0.32 inches and the st. deviation was 0.08. Find the 95% confidence interval.
You Try • In a random sample of 10 adults from the U.S., the mean waste generated per person per day was 4.3 pounds and the st. deviation was 1.2 pounds. Find the 90% confidence interval.
Example…… • The pulse rates for 13 adult women were: 83,58,70,56,76,64,80,76,70,97, 68,78,108 • Find the 90% CI.
Put #’s in L1 Press Stat, Calc, One-Var Stats L1 Answer……
You Try…… • The SAT scores for 12 high school students are: 1424, 1223, 987, 692, 947, 723, 837, 721, 747, 540, 623, 1445 • Construct the 99% confidence interval for the population mean.
Extra Example…… • The GPA for 15 students are listed below: 2.3, 3.3, 2.6, 1.8, 0.2, 3.1, 4.0, 0.7, 2.3, 2.0, 3.1, 1.4, 1.3, 1.6, 1.6 • Construct a 90% confidence interval.