Download
1 / 19
190 likes | 1.09k Vues
RESIST Trials - Grade 3 or 4 AST, ALT or Total Bilirubin: Actions and Outcomes. Use of Lipid Lowering Drugs in RESIST. Percentage. n=108. n=102. n=130. n=79. n=238. n=181. Lipid Lowering Agent Use Among RESIST Participants.

E N D
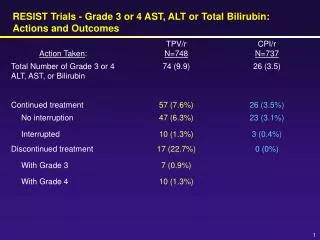
RESIST Trials - Grade 3 or 4 AST, ALT or Total Bilirubin:Actions and Outcomes
Use of Lipid Lowering Drugs in RESIST Percentage n=108 n=102 n=130 n=79 n=238 n=181 Lipid Lowering Agent Use Among RESIST Participants Note: agents included are statins, fibrates, and omega-3 fatty acids
445 (298, 634) 390 (259, 581) 367 (286, 568) 355 (230, 538) N 63 63 118 118 # deter 3 4 6 3 Effect of LLD on triglycerides: RESIST
18 17.26 16 14 12 10 8.20 8 6 4 2 0 0 4 8 12 16 20 24 28 32 36 40 44 48 Exposure (weeks) TPV/r CPI/r Risk Confirmed (3 times) Triglycerides Above 500 mg/dl for RESIST Patients Probability of event (%) Note: Included are RESIST participants who had baseline triglycerides <500 and developed at least 3 determinations above 500 mg/dL
70 60 50 40 30 % baseline background RTI susceptibility scores <2 20 10 0 0 1 2 3 4 Number of key mutations Reduced GSS as Key Mutations Increase
Hypertriglyceridemia:Relative Contribution of TPV and RTV Median baseline and maximal increase in serum triglycerides accordingto dose among Trial 1182.52 participants
Analysis of Treatment Response at Week 48 n = Number of responders N = Number of evaluable patients Treatment difference and confidence interval weighted for the size of enfuvirtide and PI strata
K-M Probabilities for Grade 3 or 4 ALT and/or ASTThrough 120 Weeks in 8 HIV+ Integrated Trials* Events- # At Risk- * Includes TPV/r patients from 1182.2, 1182.4, 1182.6, 1182.17, 1182.51, 1182.52, and CPI/r patients who switched to TPV/r 500/200 from RESIST trials 1182.12 and 1182.48
RESIST StudiesCox Regression Model for Risk of Grade 3 or 4 ALT/AST Baseline risk factors for Grade 34 ALT/AST are similar in TPV/r and CPI/r Independent variables: age, gender, race, ΔCD4, baseline triglycerides, NRTI, NNRTI, viral load, CDC HIV stage, duration of HIV infection 10
Predictors of TPV/r Antiviral Response Multiple Regression Model 24 Weeks Estimate P Value Parameter Tipranavir/r -1.25 <0.01 Enfuvirtide Use -0.91 <0.01 Per Available Drugin OBR -0.24 <0.01 TPV Score (per mutation) 0.17 <0.01
Tipranavir trough concentrations with proton pump inhibitors
Observed data Fold Change = 30 1 log10 decline Trial 1182.52Impact of IQ on 14-Day Viral Load Response 1 0 Change from baseline at 2 weeks (log10) -1 -2 -3 0.1 1 10 30 100 1000 10,000 Inhibitory quotient
1182.52Impact of IQ on 14-Day Viral Load Response ≤5 >5–30 >30–50 >50–100 >100–150 >150 0.2 0.05 7 0 27 14 34 25 58 -0.2 -0.13 -0.4 HIV RNA log10 change from baseline -0.6 -0.8 -1 -0.98 -1.03 -1.2 -1.16 -1.25 -1.4 Inhibitory quotient
RESIST Trials24 Week VL Change according to IQ in Patients not using Enfuvirtide
RESIST Trials24 Week VL Change according to IQ in Patients using Enfuvirtide
Antiviral activity of tipranavir (ViroLogic)Non-clade B isolates Clade B biological cutoff value for TPV not yet determined (1.6X LPV or 99nM)* 102 74 116 Ref. NL4-3 (B virus) EC50 = 62 nM 38 124 Mean EC50 (nM) (three isolates each except two for clade H) No evidence that other HIV-1 clades and circulating recombinant forms have lower susceptibility to TPV than HIV-1 clade B EC50 values measured at ViroLogic Inc (South San Francisco) using the PhenoSense assay * Parkin et al, AAC, 2004, 48, 437-443