Download

1 / 36
470 likes | 1.04k Vues
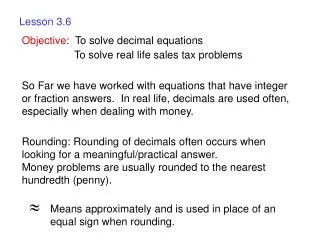
Lesson 3.6 Key Features of Exponential Functions. http:// youtu.be/FSX1U8u7eb4 http:// youtu.be/JiaSTKYz2Vg. U.S.S. Arizona Oil-Leakage.

E N D
Lesson 3.6 Key Features of Exponential Functions http://youtu.be/FSX1U8u7eb4 http://youtu.be/JiaSTKYz2Vg
U.S.S. Arizona Oil-Leakage • On December 6, 1941, the USS Arizona took on a full load of fuel—nearly 1.5 million gallons—in preparation for its scheduled trip to the mainland later that month. • The next day, much of it fed the explosion and subsequent fires that destroyed the ship following its attack by Japanese bombers. However, despite the raging fire and ravages of time, some 500,000 gallons are still slowly seeping out of the ship’s submerged wreckage. • Nearly 70 years after its demise, the USS Arizona continues to spill up to 9 quarts of oil into the harbor each day. The oil is often referred to the “Tears of Arizona” or “Black Tears”.
U.S.S. Arizona Oil-Leakage We can take the data from the oil leakage and make a table and a graph from it. The type of graph that this data will make is what we call in math an ‘Exponential Decay’.
Lesson 3.6a Key Features of Exponential Functions Concept: Characteristics of Exponential Functions Lesson EQ: How do we identify the key features of an exponential function? (Standard F.IF.4) Vocabulary: Growth Decay Asymptote y-intercept
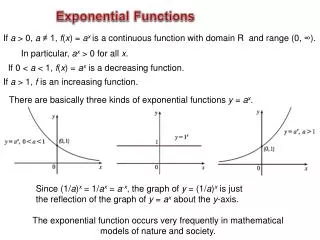
Exponential Functions General form a = initial value that determines the shape a > 1 stretch; a < 1 shrink; -a = reflection b = growth if the value is > 1 b = decay if the value is between 0 and 1 k = horizontal asymptote & vertical shift
Example: a = _____ Reflection? ______ b = _____ Growth or Decay? _________
Asymptote Line that a graph approaches but nevertouches. Example: k = _____ Horizontal asymptote is the line y = _____
y-intercept The point where the graph crosses the y-axis. The value of x is 0 at this point. Example: Substitute 0 for x and solve to find the y-intercept. y-intercept = _________
Sketch of Graph Example: • Not a reflection • Growth • Asymptote: y = 0 • y-intercept: (0,1)
Example: a = _____ Reflection? ______ b = _____ Growth or Decay? _________ k = _____ Horizontal Asymptote y = _____ y-intercept ______
Sketch of Graph Example: • Not a reflection • Decay • Asymptote: y = 0 • y-intercept: (0,1)
Example: a = _____ Reflection? ______ b = _____ Growth or Decay? _________ k = _____ Horizontal Asymptote y = _____ y-intercept ______
Sketch of Graph Example: • Not a reflection • Growth • Asymptote: y = 1 • y-intercept: (0,2)
Example: a = _____ Reflection? ______ b = _____ Growth or Decay? _________ k = _____ Horizontal Asymptote y = _____ y-intercept ______
Sketch of Graph Example: • A reflection • Decay • Asymptote: y = 3 • y-intercept: (0,2)
Guided Practice Example 1 Create a table of values for the exponential function f(x) = 2x and graph. State whether it’s a growth or decay and identify the key features. 3.4.2: Graphing Exponential Functions
Guided Practice: Example 1, continued 1. Identify the asymptote of the function. The asymptote of the function is a line that a graph approaches but nevertouches. In the general form the horizontal asymptote is always the constant, k. In the function f(x) = 2x, the value of k is 0. The horizontal asymptote of the function is y = 0. 3.4.2: Graphing Exponential Functions
Guided Practice: Example 1, continued Determine the y-intercept of the function. The y-intercept is where the graph crosses the y-axis. The value of x is 0 at this point. Substitute 0 for x and solve to find the y-intercept. y-intercept = (0, 1) It can also be seen in the table that when x = 0, f(x) =1. 3.4.2: Graphing Exponential Functions
Guided Practice: Example 1, continued Create a table of values. Choose values of x and solve for the corresponding values of f(x). Growth or Decay? 3.4.2: Graphing Exponential Functions
Guided Practice: Example 1, continued Graph the function. Use the table of values to create a graph of the function. 3.4.2: Graphing Exponential Functions
Guided Practice: Example 1, continued State the Domain and Range of the function. The domain is all x-values. Domain = all real numbers because any number can be used as x. The range is all y-values. Range = all numbers > asymptote. y > 0 ✔ 3.4.2: Graphing Exponential Functions
Guided Practice: Example 1, continued 6. Describe the end behavior of the graph. The end behavior is what happens at the ends of the graph. Exponential functions have 2 end behaviors. One towards + or - infinity and the one towards the horizontal asymptote. As x +∞, y +∞ As x -∞, y 0 ✔ 3.4.2: Graphing Exponential Functions
Guided Practice Example 2 Create a table of values for the exponential function and graph. State whether it’s a growth or decay and identify the key features. 3.4.2: Graphing Exponential Functions
Guided Practice: Example 2, continued Create a table of values. Choose values of x and solve for the corresponding values of f(x). Growth or Decay? 3.4.2: Graphing Exponential Functions
Guided Practice: Example 2, continued 2. Graph the function. Use the table of values to create a graph of the function. 3.4.2: Graphing Exponential Functions
Example 2: • Horizontal Asymptote: • y-intercept: • Domain: All real #s • Range: • End behavior: As x +∞, y As x -∞, y
Guided Practice: Example 1, continued 27 3.4.2: Graphing Exponential Functions
Think/Pair/Share • Between you and your partner, who has the longest hair? This person is the 2 • 2s explain to the 1s how they can tell if it is a growth or decay. • 1s explain to the 2s how to find the y-intercept and asymptote. • 2s explain to the 1s the domain and range. • 1s explain to the 2s the end behavior.
Your turn…… For each problem graph the function and identify the y-intercept, asymptote, domain and range, and end behavior.
1. f(x) = 3x • Asymptote: • y-intercept: • Domain: • Range: • End behavior:
2. • Asymptote: • y-intercept: • Domain: • Range: • End behavior:
Guided Practice Example 3 Create a table of values for the exponential function 1 and graph. State whether it’s a growth or decay and identify the key features. 3.4.2: Graphing Exponential Functions
Guided Practice: Example 3, continued Create a table of values. Choose values of x and solve for the corresponding values of f(x). Growth or Decay? 3.4.2: Graphing Exponential Functions
Guided Practice: Example 3, continued 2. Graph the function. Use the table of values to create a graph of the function. 3.4.2: Graphing Exponential Functions
Example 3: • Horizontal Asymptote: • y-intercept: • Domain: All real #s • Range: • End behavior: As x +∞, y As x -∞, y
Summarizing Strategy: Example for Absent friend Your absent friend needs you to show them an example of what they missed. Choose 3of the following 5 features to identify for this exponential function: f(x) = 3x – 2 • Asymptote • y-intercept • Domain • Range • End Behavior