1 / 58

GREENWOOD SCHOOL DISTRICT

GREENWOOD SCHOOL DISTRICT. Annual Report to the Public October 10, 2013. “Providing Excellence In Education”. Board Training. Total hours of training for each member Clifton James 21.60 hours Rozanne Sterling 32.00 hours Greg Hasley 58.50 hours

gburns
Télécharger la présentation

GREENWOOD SCHOOL DISTRICT

An Image/Link below is provided (as is) to download presentation Download Policy: Content on the Website is provided to you AS IS for your information and personal use and may not be sold / licensed / shared on other websites without getting consent from its author. Content is provided to you AS IS for your information and personal use only. Download presentation by click this link. While downloading, if for some reason you are not able to download a presentation, the publisher may have deleted the file from their server. During download, if you can't get a presentation, the file might be deleted by the publisher.

E N D

Presentation Transcript


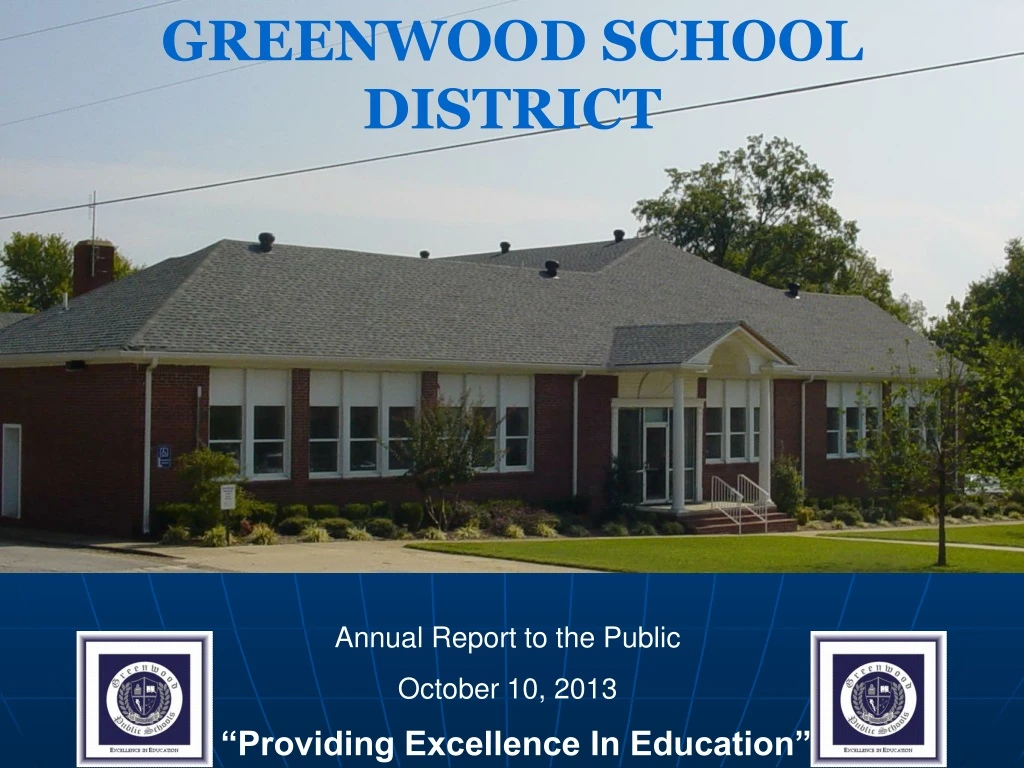
  1. GREENWOOD SCHOOL DISTRICT Annual Report to the Public October 10, 2013 “Providing Excellence In Education”

  2. Board Training Total hours of training for each member Clifton James 21.60 hours Rozanne Sterling 32.00 hours Greg Hasley 58.50 hours Jeff Turner 72.35 hours Todd Hales 88.50 hours Paul McCollom 273.75 hours Mary Ann Sandifer 300.25 hours

  3. Stay connected with us at: Facebook.com: Greenwood School District Twitter@ GSD_Excellence Free App: Greenwood School District

  4. STUDENT POPULATION October 1, 2007 enrollment - 3,532 October 1, 2008 enrollment - 3,523 October 1, 2009 enrollment - 3,550 October 1, 2010 enrollment - 3,587 October 1, 2011 enrollment - 3,541 October 1, 2012 enrollment - 3,592 October 1, 2013 enrollment – 3,596 October 1, 2014 enrolment - XXXX

  5. Enrollment by SchoolOctober 1, 2013 • East Pointe (K-5) 797 • Westwood (K-5) 838 • East Hills (6-7) 586 • Jr. High (8-9) 590 • High School (10-12) 785

  6. GreenwoodPublic Schools Benchmark Results 2013

  7. 3rd Grade MathematicsEconomic Disadvantaged

  8. 3rd Grade MathematicsIEP

  9. 3rd Grade LiteracyEconomic Disadvantaged

  10. 3rd Grade LiteracyIEP

  11. 4th Grade MathematicsEconomic Disadvantaged

  12. 4th Grade MathematicsIEP

  13. 4th Grade LiteracyEconomic Disadvantaged

  14. 4th Grade LiteracyIEP

  15. 5th Grade MathematicsEconomic Disadvantaged

  16. 5th Grade MathematicsIEP

  17. 5th Grade LiteracyEconomic Disadvantaged

  18. 5th Grade LiteracyIEP

  19. 6th Grade MathematicsEconomic Disadvantaged

  20. 6th Grade MathematicsIEP

  21. 6th Grade LiteracyEconomic Disadvantaged

  22. 6th Grade LiteracyIEP

  23. 7th Grade MathematicsEconomic Disadvantaged

  24. 7th Grade MathematicsIEP

  25. 7th Grade LiteracyEconomic Disadvantaged

  26. 7th Grade LiteracyIEP

  27. 8th Grade MathematicsEconomic Disadvantaged

  28. 8th Grade MathematicsIEP

  29. 8th Grade LiteracyEconomic Disadvantaged

  30. 8th Grade LiteracyIEP

  31. GreenwoodPublic Schools ITBS Results 2013

  32. 1st Grade - Reading

  33. 1st Grade - Math

  34. 2nd Grade - Reading

  35. 2nd Grade - Math

  36. 9th Grade - Reading

  37. 9th Grade - Math

More Related