Download

1 / 28
280 likes | 297 Vues
Explore historical Indian rainfall data, model projections, and implications of monsoon changes for climate and migration.

E N D
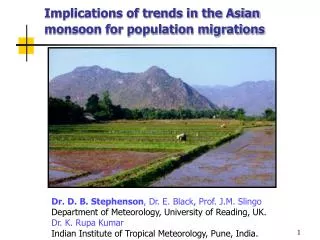
Implications of trends in the Asian monsoon for population migrations Dr. D. B. Stephenson, Dr. E. Black, Prof. J.M. Slingo Department of Meteorology, University of Reading, UK. Dr. K. Rupa Kumar Indian Institute of Tropical Meteorology, Pune, India.
Outline of this talk • Motivation • Historical trends in Indian rainfall • Model projections of future changes • Conclusions
1. Motivation Question: Why study the Asian monsoon ? Answers: • It effects the lives of many people • It is a major climate phenomenon • We do not fully understand it
Cities with more than 100,000 people in 1997 Source: United Nations Statistics Division More than 50% of the world population lives in Asia
Population of major cities in Asia in 1997 Source: United Nations Statistics Division
World population prospects … Source: United Nations Population Division 1998 India predicted to be the most populated country by 2050
Mean winter rainfall totals (December to February) 1968-1996 (mm) Note the intense tropical convergence zones
Mean summer rainfall totals (June to August) 1968-1996 Note the large amount of rainfall over the Asian region
2. Historical trends in Indian rainfall • Why focus on India ? • Historical behaviour from 1871-1999 • Any evidence of long-term trends ? • What about regional trends ?
Rainfall measurements over India Fig. 1 from Stephenson et al. 1999 Extreme daily rainfall events and their impact on ensemble forecasts of the Indian monsoon Monthly Weather Review Vol 127, pages 1954-1966 Circles show rain gauges and contours show elevation above sea-level. Good spatial coverage with more than 300 rain gauges
Daily rainfall at Mumbai in 2000 More than 90% of the annual rainfall occurs in June-September
Evolution of the June-September All-India Rainfall Small trend -0.01%/year not statistically significant
Trends in volatility of All-India rainfall • Since 1990s AIR has been less volatile than average • Decreasing trend of –0.09%/year not stat. significant
Long-term regional trends in Indian summer rainfall Trend in %/100yr % exp. variance Small significant increasing/decreasing trends < +/- 0.1%/yr
3. Model projections for the future • Can climate models simulate the monsoon ? • Stephenson et al. (1998), J. Met. Soc. Japan, Vol. 76, pp. 237-265 • Martin et al. (2000), Atmos. Sci. Letters, Volume 1. • The likely changes due to global warming • Understanding the monsoon and its impacts – the PROMISE project
IPCC 2001 climate change scenarios A1: A world of rapid economic growth and rapid introductions of new and more efficien technologies A2: A very heterogenous world with an emphasis on familiy values and local traditions B1: A world of „dematerialization“ and introduction of clean technologies B2: A world with an emphasis on local solutions to economic and environmental sustainability 9 state-of-the-art climate models run until 2100 with various emission scenarios
The annual mean change of temperature (map) and the regional seasonal change (upper box: DJF; lower box: JJA) for the scenarios A2 and B2 Source: IPCC 2001 Cubasch
Predicted precipitation change 2080-2000 Source: IPCC 2001 Cubasch
Predicted precipitation change 2080-2000 Source: IPCC 2001 Cubasch
Monsoon wind shear expected for doubled CO2 • Global warming results in a weaker dynamical monsoon ! • See Stephenson et al. (2001), Mausam, Vol. 52, p. 213-220.
Monsoon rainfall expected for doubled CO2 Slight increase in general BUT not always ! See Stephenson et al. (2001), Mausam, Vol. 52, p. 213-220.
Predicted runoff change by 2050 Predicted change in runoff in 2050 compared to 1990-1996 with CO2 forcing (IPCC 2001). HadCm2 HadCm3
Predictability and variability of monsoons and the agricultural and hydrological impacts of climate change The PROMISE monsoon project A 3 year research project funded under framework 5 of the European Union (grant number EVK2-CT-1999-00022) http://ugamp.nerc.ac.uk/promise
The European partners • University of Reading, UK • CIRAD, France • Meteo-France, France • Danish Met. Inst., Denmark • Centre for Ecology and Hydrology, UK • University of Paris, France • Max-Planck Institute, Germany • Met Office, UK • ECMWF, UK • University of Boulogne, France • CINECA, Italy A 3 year research project funded under framework 5 of the European Union (grant number EVK2-CT-1999-00022) http://ugamp.nerc.ac.uk/promise
The main aims of PROMISE The project aims to improve understanding of: Assessment of anthropogenic climate changes for monsoon climates Impact of climate change on ground hydrology and agriculture Natural variability and predictability of current monsoon climates The potential for seasonal monsoon prediction and the benefits that would accrue in terms of the management of water resources and agriculture The impacts of climate change on tropical countries, in particular on the availability of water resources for human use and on the productivity of crops and the potential changes in natural vegetation
Main areas of research Sensitivity of monsoon variability to sea surface temperatures Seasonal predictability and natural variability of monsoon climates Hydrological and agricultural impacts of climate change in monsoon-affected countries Sensitivity of monsoon variability to land-surface processes Assessment of future monsoon climates Impact of land-use changes on future monsoon climates
Summary See www.met.rdg.ac.uk/cag/MOL (Monsoon Online) for more monsoon information and contact details
Maximum water budget per person … P=852mm * A=3287263 sq. km / n=1000 million Q=2800 cubic metres of water per person per year 10% increase in P AND 50% increase in N Q will decrease by a factor of 1.1/1.5=0.73 (I.e. 2053 cubic metres) Increased rainfall due to climate change is unlikely to offset increased population demand for water. Better water management techniques will need to be developed and employed (e.g. water recycling). N.B. These rough calculations IGNORE evaporation AND runoff !