Download
1 / 43
440 likes | 741 Vues
The Implications of an Aging Population. Steven P. Wallace, Ph.D. Professor, UCLA School of Public Health Assoc. Dir., UCLA Center for Health Policy Research swallace@ucla.edu. Today’s talk. Why is American growing older? Should we care? Nation’s health promotion goals

E N D
The Implications of an Aging Population Steven P. Wallace, Ph.D. Professor, UCLA School of Public Health Assoc. Dir., UCLA Center for Health Policy Research swallace@ucla.edu
Today’s talk • Why is American growing older? • Should we care? • Nation’s health promotion goals • Public health approach to aging
1. Why is American growing older? Population versus individual aging
Fertility changes past centuryAnnual live births per 1,000 women aged 15-44 years 2008 SOURCE: NCHS, http://www.cdc.gov/nchs/data/statab/natfinal2001.annvol1_01.pdf & http://www.cdc.gov/nchs/data/nvsr/nvsr57/nvsr57_07.pdf & Health U.S., 2011
Total fertilityNumber expected lifetime births per woman SOURCE: NCHS, http://www.cdc.gov/nchs/births.htm
Percent women 40-45 w/o kids SOURCE: Pew Research Center, 2010 www.pewsocialtrends.org/2010/06/25/childlessness-up-among-all-women-down-among-women-with-advanced-degrees/
Concentration of death in old ageIn 1900, 41% live to old age, in 2006 83% do http://www.cdc.gov/nchs/data/nvsr/nvsr56/nvsr56_09.pdf
Life expectancy at age 65 50% increase in last century Source: http://www.agingstats.gov
Life expectancy at age 65 Racial disadvantage continues into old age Source: http://www.agingstats.gov
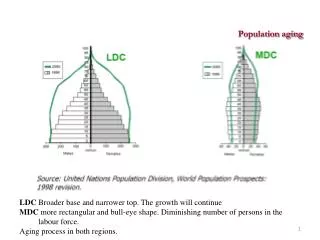
Why is America aging? • Declining birth rates = fewer kids • Declining mortality rates = more elderly
Population, Number Kids & Elders, 1900 - 2050 2040=81.2 million 2010=40.2 million elderly Number of elderly will double in 30 years Source: U.S. Bureau of the Census, p25-1130 & historical statistics
Minority elderly population, 2000-2010 2030=17.6 million Numbers triple 30 years 2000=5.6 million Source: U.S. Bureau of the Census, p25-1130 & historical statistics
Growing Diversity of Elderly in California, % nonLatino white Source: California Department of Finance, January 2013 http://www.dof.ca.gov/research/demographic/reports/projections/P-2/
Growing Diversity of Elderly in California Source: California Department of Finance, January 2013 http://www.dof.ca.gov/research/demographic/reports/projections/P-2/
Total Dependency Ratio[0-18 + 65&up / (19-64)]*100 Sources: U.S. Census, P25-1130 (1996)
Labor Force Participation Rates Source: Fullerton, Monthly Labor Review, Dec 1999
Percent GDP spending on health vs. % population age 65+, 2006 U.S. Germany Canada France Italy Australia UK Spain Japan Sources: Older Americans 2008 and http://www.who.int/whosis/whostat/EN_WHS09_Table7.pdf
Leading causes of death falling Persons Age 75-84, U.S. SOURCE: NCHS, http://www.cdc.gov/nchs/datawh/statab/unpubd/natality/natab2003.htm And Health US 2008.
Disease patterns of the elderlyU.S. 2010-11 Source: http://www.agingstats.gov
Disability at age 65+ is decreasing • Age-adjusted disability rates falling: 35% in 1992 to 29% in 2009 • ADLs: getting out of bed/chair, walking, bathing, dressing, eating, using the toilet Source: www.agingstats.gov
Fair/poor self-assessed health at ages 65 -75 decreasing • Fair & poor (versus excellent, very good, & good) self assessed health declining, i.e. good health improving! Source: NCHS, Health U.S. 2008, http://www.cdc.gov/nchs/hus.htm
Help With Daily Activities, Community Residents W/2+ ADLs, By Age Source: Kaye H S et al. Health Affairs 2010;29:11-21
Demography is not destiny • Proportion of the elderly population does not necessarily determine health care spending • Higher rates of illness & disability, but… • Continued health improvements can counter increased needs caused by growing population • Public health approaches are the most promising to improve health outcomes of the elderly
3. Nation’s health promotion goals #1-Attain high-quality, longer lives free of preventable disease, disability, injury, and premature death • Focus on the quality of the years, not just their quantity
Beyond disease: Geriatric health • Chronic conditions: Falls, Disability, Urinary incontinence, Oral Health • Environment: Food insecurity, Social support, Polypharmacy, Healthy communities See Wallace, Steven P. “The Public Health Perspective on Aging.” Generations. 29:2(2005) http://www.generationsjournal.org/generations/gen29-2/article_thepublichealth.cfm
Multiple falls by age, California Source: 2010-11 California Health Interview Survey
Food insecurity by income, age 65+ California Source: 2010-11 California Health Interview Survey
Geriatric Issues - Summary • Several challenges to healthy aging are common among the oldest and poorest elders • Healthy aging is more than avoiding disease
4. Public health approach • Definition of Public Health = Assuring the conditions under which people can be healthy(Institute of Medicine, Committee for the Study of the Future of Public Health. The future of public health. Washington, DC: National Academy Press, 1988) • Population / community / system focus • Interest in prevention vs. cure • Emphasis on health vs. disease
Types of prevention • Primary – prevent problem from happening, e.g. immunizations
Types of prevention • Primary • Secondary – detect problem early and treat before serious harm results, e.g. blood pressure or breast cancer screening
Types of prevention • Primary • Secondary • Tertiary – after a health problem has happened, maximize independence & quality of life, e.g. rehab, in-home supportive services
Falls - a public health approach • Primary – Promote physical activity, reduce polypharmacy, universal housing design (for all older adults) • Secondary - Strength training, environmental modifications (for at-risk older adults) • Tertiary – Counseling to decrease fear of falling, improve primary care ID/treatment of falls, social support interventions
Poverty – a cross cutting risk • Primary – Assure a living wage with adequate health care and pension • Secondary – Maintain the communal risk feature & disability benefits of Social Security • Tertiary – Provide public assistance (SSI) at the Elder Economic Security Standard level
Poor and near poor, Age 65 & Over, California 2010 * nonLatino # may be of any race Source: U.S. Census, 2011 American Community Survey
Distribution of household expenditures, 2010 Source: 2012 AgingStats.gov
The Problem: Federal Poverty Guideline The current measure needs to be revised: it no longer provides an accurate picture of the differences in the extent of economic poverty among population groups or geo-graphic areas of the country, nor an accurate picture of trends over time. The current measure has remained virtually unchanged over the past 30 years. Yet during that time, there have been marked changes in the nation’s economy and society .... (National Research Council, 1995, page 1)
Elder Economic Security Standard (EESS) • Adjusted for local (county) costs of living versus national average • Takes actual costs of basic necessities for older households • Includes housing, food, transportation, health care, and other costs
Elder Standard Index 2011, Single older adult , LA City & Humboldt County Note: Numbers may not add up to total due to rounding.
Conclusions • The U.S is becoming older as a nation • Demography is not destiny with improving health and changing medical practice • Healthy aging goes beyond adding years to life and focuses on adding life to years – involves increased attention to chronic and nonfatal conditions • Public health approaches to prevention using multilevel interventions are possible to reduce challenges to healthy aging… including using a more realistic assessment of “poverty”
Thank you www.healthpolicy.ucla.edu