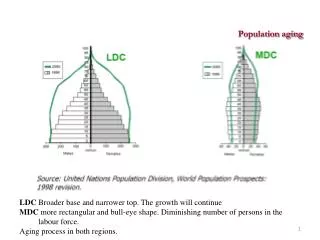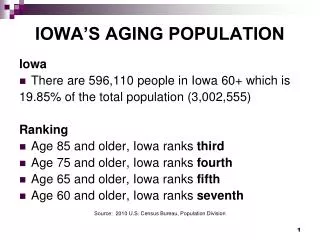
The Aging Population
The Aging Population. Percent Growth in U.S. Population, 1986-2006 by Age Bracket. Source: U.S. Census Bureau. Growth in U.S. Population Over Five-Year Intervals, 1986-2006. Source: U.S. Census Bureau. The Impact of Traditional Students on Total College Enrollment.

The Aging Population
E N D
Presentation Transcript
Percent Growth in U.S. Population, 1986-2006by Age Bracket Source: U.S. Census Bureau
Growth in U.S. Population Over Five-Year Intervals, 1986-2006 Source: U.S. Census Bureau
The Impact of Traditional Students on Total College Enrollment Source: U.S. Department of Education/U.S. Census Bureau
Student Enrollments, 1986-2016by Age Bracket Source: U.S.Department of Education
College Enrollment Profile, 1986-2016by Age Bracket Source: U.S. Department of Education
Undergraduate Enrollment by Attendance Status 1986-2016 Source: U.S. Department of Education
Change in Part-Time Enrollment, 1986-2016 Source: U.S. Department of Education
Graduate and Professional Enrollment, 1986-2016by Attendance Status Source: U.S. Department of Education
Gender and Attendance Status1985-2015 Source: U.S. Department of Education
Growth Rate of U.S. Population by Ethnic Group1981-2051 Source: U.S. Census Bureau
Growth in U.S. Population by Ethnic Group1981-2051 Source: U.S. Census Bureau
Concentration of Minorities Enrolled in Public Elementary/Secondary Schools, 2003-04, and Selected Changes from 1993-94 +10.1% +9.9% +19.7% +19.4% +9.6% +10.4% +10.1% More than 50% +9.0% 36% to 50% +11.2% 21% to 35% 10% to 20% Less than 10% Source: U.S. Department of Education
High School Graduation Rates by Ethnic Group1999-2006 Source: U.S. Census Bureau
College-Going Rates of High School Graduates Aged 18 to 24 by Ethnic Group, 1999-2006 Source: U.S. Census Bureau
Concentration of Minorities Enrolled in Higher Education, 2005-06and Selected Changes from 1994-95 +10.9% +9.0% +10.5% +15.4% +12.5% +9.8% +9.9% +11.7% +9.7% +14.8% +11.6% More than 40% +10.6% +9.4% +12.4% +10.5% 31% to 40% +9.0% 21% to 30% +13.6% 11% to 20% 0 to 10% Source: U.S. Department of Education
Growth in College Enrollment by Ethnic Group1994-95 to 2005-06 Source: U.S. Department of Education
Racial-Ethnic Distribution in College Enrollment 1994-95 to 2005-06 Source: U.S. Department of Education
Minority Males as a Percent of Total College Enrollment, 1994-95 to 2005-06 Source: U.S. Department of Education
Minority Females as a Percent of Total College Enrollment, 1994-95 to 2005-06 Source: U.S. Department of Education
Ratio of Bachelor’s Degrees Earned to Enrollments1993-94 to 2003-04 Source: U.S. Department of Education
2006 High School Seniors: Graduation and Four-Year College EnrollmentSelected States
2006 High School Seniors: Graduation and Four-Year College Enrollment: California Source: The College Board/U.S. Department of Education
2006 High School Seniors: Graduation and Four-Year College Enrollment: Florida Source: The College Board/U.S. Department of Education
2006 High School Seniors: Graduation and Four-Year College Enrollment: Massachusetts Source: The College Board/U.S. Department of Education
2006 High School Seniors: Graduation and Four-Year College Enrollment: New York Source: The College Board/U.S. Department of Education
2006 High School Seniors: Graduation and Four-Year College Enrollment: Ohio Source: The College Board/U.S. Department of Education
2006 High School Seniors: Graduation and Four-Year College Enrollment: Texas Source: The College Board/U.S. Department of Education
Percent Change in Resident Population, 1985-2005by College Board Region Source: U.S. Census Bureau
Percent of High School Graduates Enrolled in a Four-Year College Outside Their Home StateFall 2004 +5% CT -6% -18% -9% DE +10% MD+6% +7% -6% -11% 50% or more 30% to 49% 15% to 29% -27% -11% Less than 15% Source: U.S. Department of Education
States with Largest Net Migration of Four-YearCollege Freshmen, Fall 2004 Source: U.S. Census Bureau
Change in Intended Major 1976-77 to 2006-07 Source: CIRP
Trends in Concern About Ability to Finance a College Education, 1976-77 to 2006-07 Source: CIRP
Percent For Whom Financing was a Major Concern 1992-93 to 2006-07 (Selected Years) Source: CIRP
Trends in Rate of Increase in Total Four-Year College Costs, 1979-80 to 2005-06 Source: U.S. Department of Education
Trends in Rate of Increase in Four-Year College Tuition & Fees, 1979-80 to 2005-06 Source: U.S. Department of Education
College Costs and Disposable Per Capita Income, 1996-97 to 2006-07 Source:The College Board
Year-to-Year Change in College Costs and Disposable Income, 1996-97 to 2006-07 Source:The College Board
Types of Financial Aid as a Percentage of Total, 1995-96 to 2005-06 Source:The College Board
Sources of Financial Aid as Percentage of Total, 1995-96 to 2005-06 Source:The College Board