Download
1 / 21
210 likes | 328 Vues
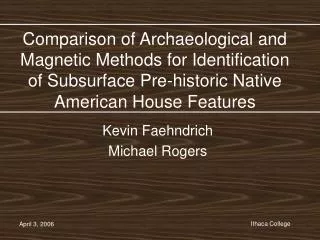
Cesium Magnetometer Surveys at a 1,000-year-old Pithouse Village Site in Southwestern, NM. Kevin Faehndrich, Michael Rogers, Greg Shear. Acknowledgements : -University of Nevada – Las Vegas -Ithaca College Physics Ford Research Fund -Ithaca College Dana Internship

E N D
Cesium Magnetometer Surveys at a 1,000-year-old Pithouse Village Site in Southwestern, NM. Kevin Faehndrich, Michael Rogers, Greg Shear Acknowledgements: -University of Nevada – Las Vegas -Ithaca College Physics Ford Research Fund -Ithaca College Dana Internship -Ithaca College summer Faculty salary
Project Goals • Identifying magnetic signals associated with extramural features. • Identifying magnetic signals associated with pithouses. • Testing effectiveness of our surveying method at the Gila Encantada Site
Project Motivation Image credit: nature.org/wherewework/fieldguide/projectprofiles/gmh.html
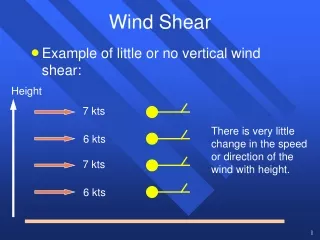
How a Magnetic Survey Works Earth’s local magnetic field Magnetic field of buried object
Cesium Magnetometer Battery Belt Control Unit Sensors
5490 GBRS Local-Y Grid Coordinate (m) GBRS Local-X Grid Coordinate (m) 5430 1480 1500 How the Survey was Conducted 5540 PSD GBRS Local-Y Grid Coordinate (m) 5380 1460 1580 GBRS Local-X Grid Coordinate (m)
Results Figure 1 Shaded Relief Plot Figure 2 Image Plot 5490 49200 5490 49160 49120 49080 49040 GBRS Local-Y Grid Coordinate (m) 49000 GBRS Local-Y Grid Coordinate (m) 48960 48920 48880 48840 48800 5430 5430 1480 1500 1480 1500
5540 2 6 1 7 5 3 4 25 8 PSD 9 14 13A 13B 20 GBRS Local-Y Grid Coordinate (m) 15A 10 15B 28 12 19a 19b 11 16 21 18 22a 24 22b 17 23 27 26 5380 1460 1580 GBRS Local-X Grid Coordinate (m) Future Projects