Wind Shear
Hodograph diagrams illustrate wind speed and direction changes with altitude. Learn to interpret hodographs for weather analysis.

Wind Shear
E N D
Presentation Transcript
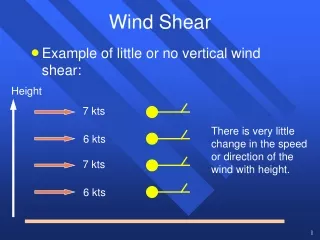
Wind Shear • Example of little or no vertical wind shear: Height 7 kts There is very little change in the speed or direction of the wind with height. 6 kts 7 kts 6 kts
Hodograph • A hodograph displays the change of wind speed and direction with height (vertical wind shear) in a simple diagram. • Wind speed and direction are plotted as arrows (vectors) with their tails at the origin and the point in the direction toward which the wind is blowing. This is backward from our station model!!!
Hodograph • The length of the arrows is proportional to the wind speed. The larger the wind speed, the longer the arrow. • Normally only a dot is placed at the head of the arrow and the arrow itself is not drawn. • The hodograph is completed by connecting the dots!
Hodograph • Why Draw a Hodograph? • We don’t have to look through a complex table of numbers to see what the wind is doing. • By looking at the shape of the hodograph curve we can see, at a glance, what type of storms may form. • Air Mass (garden variety) storms • Multicellular Storms • Supercell Storms • Tornadic Storms
Hodograph -- Example Just by looking at this table, it is hard (without much experience) to see what the winds are doing and what the wind shear is.
Hodograph -- Example 2000 m • Let us plot the winds using a station model diagram. • This is better but it is time consuming to draw and still is not that helpful. 1500 m 1000 m 500 m SFC
Hodograph -- Example 160 Let us draw the surface observation. 160o at 10 kts Since the wind speed is 10 kt, the length of the arrow is only to the 10 knot ring. The direction points to 160o. • Let us now draw the hodograph!
Hodograph -- Example Let us draw the 500 m observation: 180o at 20 kts Since the wind speed is 20 kt, the length of the arrow is only to the 20 knot ring. The direction points to 180o. • Let us now draw the 500 m observation.
Hodograph -- Example Let us draw the 500 m observation: 180o at 20 kts Since the wind speed is 20 kt, the length of the arrow is only to the 20 knot ring. The direction points to 180o. • Let us now draw the remaining observations.
Hodograph -- Example • We now place dots at the end of the arrows then erase the arrows.
Hodograph -- Example • We then connect the dots with a smooth curve and label the points. This is the final hodograph!!! 1000 m 500 m 1500 m SFC 2000 m
Hodograph -- Example • What can we learn from this diagram? • We see that the wind speeds increase with height. • We know this since the plotted points get farther from the origin as we go up. • We see that the winds change direction with height. • In this example we see that the hodograph is curved and it is curved clockwise. • If we start at the surface (SFC) and follow the hodograph curve, we go in a clockwise direction!
Hodograph -- Example This hodograph is from Jackson, MS on 19 March 1998 at 12Z. This is essentially a straight-line hodograph. The winds change direction near the surface and then are out of the west from about 600 mb up. There is a maximum in the wind speed at about 150 mb then the winds slow down a bit. This computer generated hodograph does not plot the height levels on the diagram. The height data may be omitted if there are a lot of data points to plot.