Understanding Constant Pressure Maps: Analyzing Height and Pressure in Weather Forecasting
Constant pressure maps, such as upper air observations, depict the relationship between pressure and height in the atmosphere. On a surface weather map, height remains constant while pressure varies. Measurements come primarily from the Automated Surface Observation System (ASOS) and radiosonde data, providing crucial insights into weather patterns. Analyzing various pressure levels (e.g., 850 mb, 500 mb) aids meteorologists in identifying wind patterns, moisture advection, and temperature profiles, which are essential for accurate weather forecasting.

Understanding Constant Pressure Maps: Analyzing Height and Pressure in Weather Forecasting
E N D
Presentation Transcript
Constant Pressure Maps ATMO 4300 Spring 2008
Two Related Variables • Height and Pressure • On a surface weather map, height is constant and pressure varies • What height is used and why?
Surface Weather MapFigure from www.rap.ucar.edu/weather/model
Question • Where does the information come from that is plotted on a surface weather map? • Mostly from ASOS (Automated Surface Observation System)
Upper Air Maps • Also called constant pressure maps • On these maps, pressure is constant and height varies
Question • Where does the information come from that is plotted on a constant pressure map?
Upper Air Observations • Radiosonde • Measures temperature, pressure, humidity • Rawinsonde - wind • Figure from www.erh.noaa.gov/er/gyx
Launching a Radiosonde Photo from www.srh.noaa.gov/mob/balloon.shtml; map from www.srh.noaa.gov/bmx/upperair/radiosnd.html
Depicting Upper Air Data • 1. Constant Pressure Maps • 2. Temperature/height diagram: Vertical profile of temperature, dew point and wind
Depicting Upper Air Data • 1. Constant Pressure Maps
Standard Upper Air Maps PressureHeight (ft)Height (m) • 200 mb 39,000 ft 12,000 • 300 mb 30,000 ft 9000 • 500 mb 18,000 ft 5500 • 700 mb 10,000 ft 3000 • 850 mb 5,000 ft 1500
Constant Pressure Maps • Pressure decreases with height • Rate of decrease varies • Height of a given pressure varies 500 500 500 up 500
Question • Why does the height of a constant pressure surface vary from place to place?
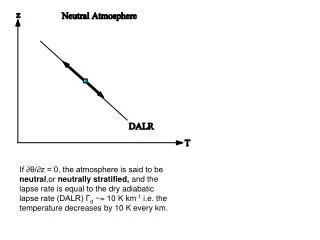
Temperature & Density • Which column has the greater density? • Pressure decreases at a greater rate with height in the cold air • Figure from apollo.lsc.vsc.edu/classes/met130
Construction of a 500 mb Mapupper left map from www.srh.noaa.gov/bmx/upperair/radiosnd.html 1 3 2 500 4 500 500 500
Use of Const. Press. Maps • 850 mb map - Low level winds – Low Level Jet (LLJ) - Temperature advection – vertical motion - Moisture advection - Frontal zones
Use of Const. Press. Maps • 700 mb map - Temperature advection – vertical motion - Winds - Relative Humidity T-Td = 5 or less: possible clouds/ upward motion - Quick look at possible cap: T > 12-14C
Use of Const. Press. Maps • 500 mb map - Identify Long-waves & Short-waves - Vorticity – related to vertical motion - Wind flow patterns (see following slides)
Upper-Level Flow • Zonal Flow – dominant W to E flow • Meridional Flow – large north/south component to the flow
Split FlowDiagram from www.theweathrprediction.com/blocking Note the northern branch and southern branch of the westerlies
Cut-Off Low Diagram from www.theweathrprediction.com/blocking
Omega BlockDiagram from www.theweathrprediction.com/blocking
Use of Const. Press. Maps • 300/250/200 mb maps - Locate Polar & Subtropical Jet Streams - Locate Jet Streaks (Jet Max)