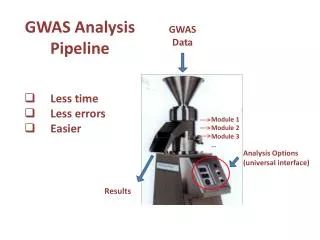
HMI Data Analysis Pipeline
Processing. HMI Data. Internal rotation Ω(r,Θ) (0<r<R). Spherical Harmonic Time series To l =1000. Heliographic Doppler velocity maps. Filtergrams. Mode frequencies And splitting. Internal sound speed, c s (r,Θ) (0<r<R). Full-disk velocity, v(r,Θ,Φ), And sound speed, c s (r,Θ,Φ),


HMI Data Analysis Pipeline
E N D
Presentation Transcript
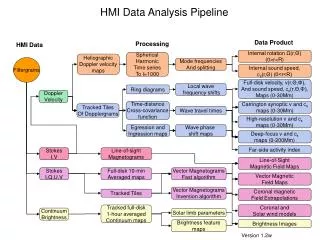
Processing HMI Data Internal rotation Ω(r,Θ) (0<r<R) Spherical Harmonic Time series To l=1000 Heliographic Doppler velocity maps Filtergrams Mode frequencies And splitting Internal sound speed, cs(r,Θ) (0<r<R) Full-disk velocity, v(r,Θ,Φ), And sound speed, cs(r,Θ,Φ), Maps (0-30Mm) Local wave frequency shifts Ring diagrams Doppler Velocity Carrington synoptic v and cs maps (0-30Mm) Time-distance Cross-covariance function Tracked Tiles Of Dopplergrams Wave travel times High-resolution v and cs maps (0-30Mm) Egression and Ingression maps Wave phase shift maps Deep-focus v and cs maps (0-200Mm) Far-side activity index Stokes I,V Line-of-sight Magnetograms Line-of-Sight Magnetic Field Maps Stokes I,Q,U,V Full-disk 10-min Averaged maps Vector Magnetograms Fast algorithm Vector Magnetic Field Maps Vector Magnetograms Inversion algorithm Coronal magnetic Field Extrapolations Tracked Tiles Coronal and Solar wind models Tracked full-disk 1-hour averaged Continuum maps Continuum Brightness Solar limb parameters Brightness feature maps Brightness Images Version 1.2w HMI Data Analysis Pipeline Data Product
Global Helioseismology Processing HMI Data Processing Data Product Science Objective Tachocline Internal rotation Ω(r,Θ) (0<r<R) Meridional Circulation Local Helioseismology Processing Filtergrams Internal sound speed, cs(r,Θ) (0<r<R) Differential Rotation Near-Surface Shear Layer Full-disk velocity, v(r,Θ,Φ), And sound speed, cs(r,Θ,Φ), Maps (0-30Mm) Activity Complexes Active Regions Carrington synoptic v and cs maps (0-30Mm) Sunspots Doppler Velocity Irradiance Variations High-resolution v and cs maps (0-30Mm) Observables Deep-focus v and cs maps (0-200Mm) Flare Magnetic Configuration Line-of-sight Magnetograms Flux Emergence Far-side activity index Magnetic Carpet Line-of-Sight Magnetic Field Maps Vector Magnetograms Coronal energetics Large-scale Coronal Fields Vector Magnetic Field Maps Solar Wind Continuum Brightness Coronal magnetic Field Extrapolations Far-side Activity Evolution Predicting A-R Emergence Coronal and Solar wind models IMF Bs Events Version 1.0w Brightness Images HMI Science Analysis Plan Magnetic Shear
Solar Dynamo Sunspot Dynamics Global Circulation Magnetic Connectivity Interior Structure Irradiance Sources Coronal Magnetic Field Far-side Imaging NOAA 9393 Far-side Solar Subsurface Weather Magnetic Stresses HMI Science Objectives - examples