Download
1 / 26
260 likes | 410 Vues
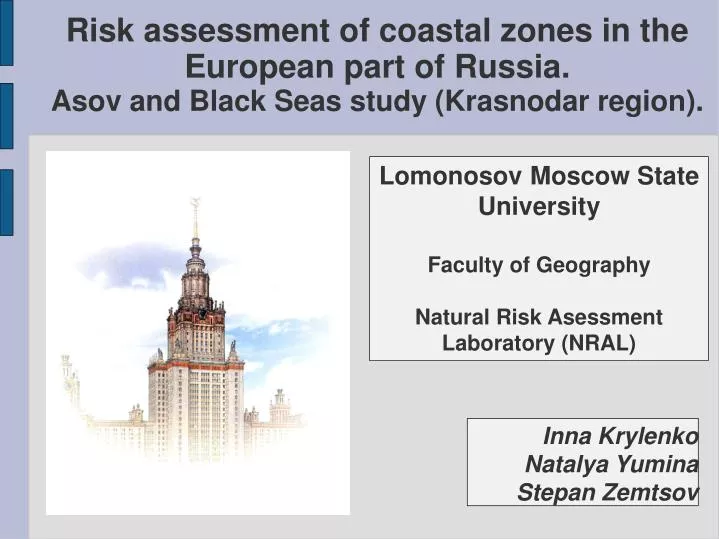
Risk assessment of coastal zones in the European part of Russia. Asov and Black Seas study (Krasnodar region). Lomonosov Moscow State University Faculty of Geography Natural Risk Asessment Laboratory (NRAL). Inna Krylenko Natalya Yumina Stepan Zemtsov. Object and purpose.

E N D
Risk assessment of coastal zones in the European part of Russia. Asov and Black Seas study (Krasnodar region). Lomonosov Moscow State University Faculty of Geography Natural Risk Asessment Laboratory (NRAL) Inna Krylenko Natalya Yumina Stepan Zemtsov
Object and purpose • Object – aqua-territorial systems as a type of social-ecological systems • Subject– influence of natural processes (river flooding) on aqua-territorial systems • Purpose – an estimation of influence (risk and damage assessment) of natural processes on aqua-territorial systems
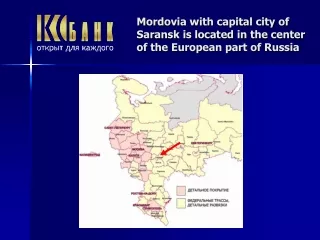
Municipal districts and main cities of Krasnodar region (Krasnodarsky kray)
The basic concepts of Russian approach Natural hazards Atmosphere Hydrosphere Litosphere Biosphere Antroposphere Ecological sphere Technosphere • Infrastructure • Fixed funds Social-economic geosystem or social-ecological system Sociosphere 1. Socio-demographic 2. Ecomomy 3. Political-administrative 4. Cultural Psychologicalsphere
Risk Asessment Methodology in Russia R = p*D R — risk p — hazard probability (%) D — expected damage D = d*S + C d — real damage per exposure area (rub*km2) — depends on flood depth, velocity, duration and land development S — exposure area (km2) C — costs of preventive measures (rub)
The scheme for selection of indicators to assess risk of flooding on regional level(N.Frolova and others, 2011, Russia) Flood risk assessment Assessment of natural hazards Vulnerability assessment Natural factors Socio-economic factors 1. Probabilityofflooding ofcoastalareas 2. Scalesofthephenomenon - maximumexcess ofthefloodinglevel - floodduration - exposurearea 3. Riverbedfactor 1. Averagepopulationdesity 2. Proportionofthepopulation inthefloodzone 3. Anthropogenicconditionality ofemergencies 4. Mainfundsintheeconomy 5. Humandevelopmentindex Map of the index of the natural hazards of flooding Mapofthesocio-economic vulnerabilityindex Map of flood risk
Map of the index of the natural hazards of flooding (N.Frolova and others, 2011, Russia) Index of the natural hazards of flooding
Map of the sociol-economic vulnerability of the territory during floods (N.Frolova and others, 2011, Russia) Socio-economic vulnerability index
Map of typological zoning of Russia on the degree of flood risk (N.Frolova and others, 2011, Russia) Classes of flood risk Low risk Insignificant risk Average risk High risk Very high risk Extremely high risk
Damage Asessment Methodology of Russian Emergency ministry • D=Dφ×θ ∑ Si КiPi • I – hazard level (1≤ i ≤3), • Dφ×θ – damage coefficient for different types of damage • Si – exposure area for each level of hazard • Кi – level of destruction coefficient • Pi – concentration coefficient: • ρi - density of population in each hazardous zone • ρфон – density of population in the region, • М – population of the region, • mi – population in the zones of low (i=1), medium (i=2) and high (i=3) hazard • Сreg - net assets value of fixed production assets for year of census, • n – years from census data, • Ki – level of destruction coefficient.
Database • Data from the Russian Statistical Service (Rosstat) for municipal districts (local level), federal ministries, departments of Krasnodarsky region administration, and etc. • More than 300 indicators for 14 municipal districts from 2007 to 2011 years • Seasonal data
Unification of variable indicator X I = (X - Xo)/(X*-Xo) (1) – monotonic increasing dependence between variable X and index I I =1-(Xo - X)/(X*-Xo) (2) – monotonic decreasing dependence Xo – minimum of variable X among N municipal districts, X* – maximum IndexIbelongs to [0,1]
Future directions • Seasonal or day / night vulnerability • Damage estimation (Russian methodology) for case area • Workshop (elaboration of indicators) • Survey (verification of methodology, search for some indicators) on the case area • Experts‘ interviews (Emergency ministry, Hydrological service, Economic department of local government, etc.) • Resilience estimation (methodology, indicators, etc.)