Download
1 / 48
480 likes | 618 Vues
This document explores the fecundity schedule and population dynamics of two species: the hermaphroditic annual plant Phlox drummondii and the Common Mud Turtle (Kinosternon subrubrum). It covers age-specific fecundity, survivorship, net reproductive rates, and geometric rates of increase. The study emphasizes the importance of understanding population growth patterns and stability, helping to inform conservation strategies for both plant and animal populations. Insights include calculations of average seeds produced, reproductive rates, and implications for species management.

E N D
Fecundity Schedule for Phlox drummondii nx= number survivors lx= survivorship • mx= Age-specific fecundity: Average number seeds produced by individual in age category.
Fecundity Schedule for Phlox drummondii • mx = Age-specific fecundity: Average number seeds produced by individual in age category. • i.e. plants 300 days old produce on average 0.3394 seeds
Fecundity Schedule for Phlox drummondii • Ro= lxmx • x = age interval • lx = proportion pop. surviving to age x • mx = Age-specific fecundity: Average number seeds produced by individual in age category. Sum these!
Annual Plant • Phlox drummondii (hermaphrodite) • Ro = Net reproductive rate; Average number seeds produced by individual during life • If > 1, population increasing • If = 1, population stable • If < 1, population declining
Annual Plant Is pop. stable, increasing, decreasing?
Annual Plant • Non-overlapping generations: can estimate growth rate (per unit time). • Geometric Rate of Increase, lambda ():
Annual Plant • Non-overlapping generations: can estimate growth rate. • Geometric Rate of Increase, lambda (): • = Nt+1 / Nt • Nt+1 = Size population future time • Nt = Size population earlier time
Annual Plant • Geometric Rate of Increase, lambda (): • Start 996 plants: 2.4177 seeds/individual (Table 10.1) • 996 x 2.4177 = 2,408 seeds start next year • = Nt+1 / Nt • = 2,408 / 996 • = 2.41 • = Rofor annual plant (generations do not overlap & reproduction not continuous)
Estimating Rates when Generations Overlap Who am I? Hermaphrodite?
Estimating Rates when Generations Overlap • Common Mud Turtle (Kinosternon subrubrum) • Data: • survivorship in age class (years) • reproductive info for each age class
How can a turtle reproduce? • Need Females! Population mix males & females • Not all reproduce • Clutch Size: # eggs laid by female/nest • How many nests/year (or time period)? mx= (% fem) x (% reproducing) x (clutch size) x (# nests)
Table 10.2 • Trick: Pop. has males & females, so calculate production females by females
Sum col. 4 in Table 10.2 (lxmx), R0 = 0.601 • Stable, increasing, decreasing?
Other population parameters • Common Mud Turtle • Average generation time (T): Average time from egg to egg between generations
Fecundity Schedule for Kinosternon subrubrum • T= xlxmx /Ro • x = age interval • lx = proportion pop. surviving to age x • mx = Age-specific fecundity: Average number eggs/seeds produced by individual in age category. Sum these!
Table 10.2: • T = 6.4 / 0.601 = 10.6 years • T = xlxmx / Ro
Other population parameters • Common Mud Turtle • Per Capita Rate of Increase (r) • r = rate population change per individual per unit time r = (ln Ro) / T • ln = natural log • Also: • r is births per individual per unit time (b) minus deaths per individual per unit time (d) • r = b - d
Estimating Rates when Generations Overlap • Common Mud Turtle r = (ln Ro) / T r = ln (0.601) / 10.6 r = -0.05 • rate population change per individual per unit time If r > 0, population increasing If r = 0, population stable If r < 0, population declining • Makes sense: • r = b - d
Organism Size and Population Density • A search for patterns………….(recall size vs. density) hi population density (log) lo lo hi body size (log)
Organism Size and Population Density • A search for patterns………….(recall size vs. density) • Generation time vs. size? • Also log-log scale Size Gen time (T)
Generation time vs. size • Positive slope • Log-log scale
Use of population dynamics info • Control invasive species (who am I?) 2008 map
Use of population dynamics info • Prevent extinction rare species (who are we?) 200 or fewer individuals in wild
Use of population dynamics info • Managing harvested species • Ex, orange roughy New Zealand Fishery areas Slimehead family!
Use of population dynamics info • Long lived (150 years) • Breed when 25-30 yr old • Harvest only large fish (allow some to breed)?
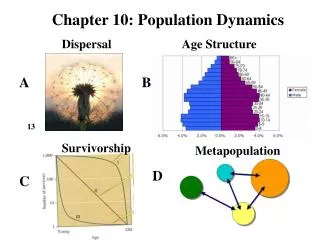
Population Density Emigration Immigration
Dispersal • Important to population dynamics • Immigration: add individuals • Emigration: lose individuals
Dispersal • Hard to study: • 1) tracking movements adults • 2) dispersal phase may be small wolf Bee!
Dispersal • Africanized Honeybees • Killer bees...
Dispersal • Africanized Honeybees • Honeybees (Apis mellifera) • subspecies • Africanized disperse faster than European honeybees.
Dispersal • Africanized Honeybees
They are Here!! • First in Mobile AL, Aug 2004! • 28 US fatalities 2010 near Albany GA Aug 2004, first
When Do Organisms Disperse? • Eggs/ Sperm/ Seed (e.g. pollen, soft corals, burrs) • Larvae/Juveniles (e.g. Corals, Fish, spiders) • Adults (e.g. Cats, Butterflies, birds) Immobile adults must disperse as Juveniles, Zygotes or Gametes!
Dispersal & Climate Change • Organisms spread northward 16,000 years ago (retreat of glaciers) • Evidence: preserved pollen in sediments.
Changes in Response to Climate Change • Tree species: Movement slow 100 - 400 m/yr. Fig. 10.6
Climate envelope: area with appropriate climate conditions American Pika (Ochotona princeps)
Climate Change Torreya taxifolia • Climate envelope: area with appropriate climate conditions • Will envelopes move too fast? • Assisted migration: human help to prevent extinctions
Dispersal in Response to Changing Food Supply • Holling: numerical responses to increased prey • Increased prey density led to increased predator density This figure from Ch. 7 showed functional responses
Dispersal in Response to Changing Food Supply • Numerical response: dispersal + increased reproduction Kestrel Owl Vole
Dispersal in Response to Changing Food Supply • Predators moved to areas of more dense prey Fig. 10.7
Dispersal in Rivers and Streams • Current (flow of water) causes drift (movement downstream) • Adaptations to maintain position: • 1) Streamlined bodies/strong swimmers Jumping salmon
Dispersal in Rivers and Streams • Adaptations to maintain position: • 2) Bottom-dwelling: avoid current • 3) Adhesion: hang on! Etowah darter Alabama hogsucker
Dispersal in Rivers and Streams • Still get washed downstream in flash floods (spates). James River VA, 1985
Dispersal in Rivers and Streams • Colonization cycle: interplay downstream & upstream dispersal
Dispersal in Rivers and Streams • Cool story: Costa Rican river snail moves upstream in migratory wave (to 1/2 million snails!)