Download
1 / 35
350 likes | 514 Vues
Population Dynamics Ch. 8. Big Picture:. Populations can be described by Distribution Numbers Age structure Density Populations cannot grow indefinitely (r) because there are limited resources and habitats (k). Distribution. Clumping Uniform dispersion Random dispersion.

E N D
Big Picture: • Populations can be described by • Distribution • Numbers • Age structure • Density • Populations cannot grow indefinitely (r) because there are limited resources and habitats (k)
Distribution • Clumping • Uniform dispersion • Random dispersion
CLUMPINGSometimes clumping occurs because some areas of habitat are more suitable than others • i.e., Plethodon sp. salamanders are found clumped under fallen logs in the forest • the night lizard Xantusia sp. is found clumped within fallen Joshua trees in the Mojave desert
Clumping cont. • Plants often clump because their seeds fall close to the parent plant or because their seeds only germinate in certain environments. Impatiens capensis seeds are heavy and usually fall close to the parent plant-this species grows in dense stands. • Species may clump for safety, or social reasons. Ground nesting bees Halictus sp. prefer to nest in the presence of other bees, forming aggregations of solitary nests
Uniform distribution • This generally happens because of interactions between individuals in the population. • Competition: Creosote bushes in the Mojave desert are uniformly distributed because competition for water among the root systems of different plants prohibits the establishment of individuals that are too close to others. • Territoriality: The desert lizard Uta sp. maintains somewhat regular distribution via fighting and territorial behavior • Human Intervention: I.e., the spacing of crops.
Random dispersion • This pattern occurs in the absence of strong attraction or repulsion among individuals. • It is uncommon. • The trees of some forest species are randomly distributed within areas of suitable habitat. • For example, fig trees in the amazon rain forest. This random distribution might be due to seed dispersal by bats.
Size/Numbers • Simply the number of individuals in the population at any given time. Sometimes called abundance.
Age Structure • This is the relative number of individuals at different ages.
Density • The number of individuals in the population per unit area or unit volume. • For many organisms, it is the density of a population rather than its actual numbers, that exerts a real effect on the organism.
Example Problem • There are 10,400 mice living in a 1000m x 1000m field. What is the density of this population?
Answer • The area of the field is 1,000,000 square meters (m2). • The density of mice is therefore 10,400 mice/1,000,000m2=.0104/m2.
Population Size Change • Birth (Natality) • Death (Mortality) • Immigration • Emigration • Population change= (B+I) – (D+E)
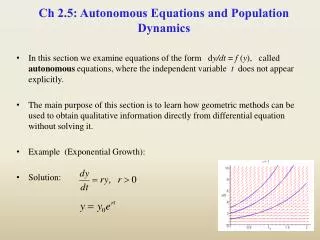
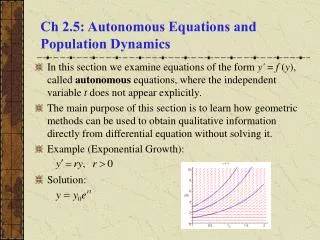
Exponential Growth • This is probably the best, simple, model of population growth…it predicts the rate of growth, or decay, of any population where the per capita rates of growth and death are constant over time. • In exponential growth models, births deaths, emigration and immigration take place continuously • This is a good approximation for the growth of most biological populations • i.e., human populations grow exponentially when resources are plentiful
J-Curve • Density independent • Results from sudden crash in population size • Outstrip resource limit • catastrophe
Exponential Growth formula • N(t)=N0ert • where r is the exponential growth parameter • N0 is the starting population • t is the time elapsed • r=0 if the population is constant, r>0 if population is increasing, r<0 if the population is decreasing.
Example problem • The human population of the earth is growing at approximately 1.8%per year. • The population at the start of 2001 was approximately 6 billion. • If nothing were to slow the rate of population growth, what would the population be in the year 2101?
Answer • N(t)=N0ert • r= .018 • t=100 years • N0=6 billion • N(100)=N0ert • N(100)=6x10⁹ert =6x10⁹*e1.8 • N(100)= 6x109*6.04= 36.3 billion
Population Dynamics • Populations tend to grow to the maximum extent possible given environmental conditions • Biotic potential • Dependent on innate biological principles • Intrinsic rate of increase (r)= rate of population growth if unlimited resources available
Not Sustained • Biotic potential cannot be sustained • Environmental resistance • Negative feedback • Snowshoe hare and lynx
Carrying Capacity • Populations grow until one or several limiting resources become rare enough to inhibit reproduction so that the population no longer grows. • The limiting resource can be light, water, nesting sites, prey, nutrients or other factors. • Eventually, every population reaches its carrying capacity, this is the maximum number of individuals a given environment can sustain.
Logistic or Sigmoid Curve • Density dependent • Recycling and renewal of resources • Establishes equilibrium around carrying capacity
Sigmoid Curve • A: lag phase • B: acceleration phase • C: exponential growth • D: deceleration phase • E: equilibrium • G: dynamic fluctuations
Changing the carrying capacity • Adaptive traits • Technological advances
Dynamic Fluctuation Phase • Density- dependent factors • Intraspecific competition • Predation • Disease • Density-independent factors • Natural disasters • Pollution • Habitat destruction (deforestation)
Factors cont. • Examples: For Neodiprion sawflies, winter surviorship is greatly affected by the weather, which is density-independent. • During the summer, however, parasitic wasps impose very high density-dependent mortality. • Pacific mussels, Mytillus sp., are largely limited by density-dependent competition for space on rocky outcrops. Occasionally, density -independent disturbance by floating logs decimates populations.
Patterns of population size • Stable • Rainforest species • Irruptive • Insects • Cyclic • Lemmings • http://www.youtube.com/watch?v=pDqlZjpSJCc • Wolf-moose interactions • Irregular • Due to catastropies
Predator- Prey Effect • Delayed density dependence
Reproduction • Sexual vs. Asexual
Reproductive Patterns:r- selected vs K-selected r-selected • Reproduce early and put most of their energy into reproduction • Many small offspring • High growth rate Population size fluctuates wildly around carrying capacity • Low ability to compete • Most offspring die before reaching reproductive age K-selected • Fewer, larger offspring • High parental care • Most offspring survive to reach reproductive age • Lower growth rate • High ability to compete • Population size fairly stable around carrying capacity
Factors that Influence Population Dynamics • Positive: enhance population growth • Negative: reduce population growth
Symbiotic Relationships • Can be positive or negative • Lichens • Coral and zooxanthelae algae • Wood termites and protozoa • Humans and gut flora
Behavior Patterns • Can be positive or negative • Migration • Territory behavior • Societies and hierarchies • Mating and courtship • Colors, patterns, physical characteristics
Biological Controls • Predators • Diseases • Pheromones
Survivorship Curve • Type I: large animals immune to predation, live to old age • Type II: mostly prey, predation is constant throughout lifespan • Type III: large numbers of young because most will be eaten, only few adults survive