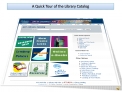
Quick Tour
Quick Tour. You can compare usage on different dates. This shows a leak identified in January 2007 and the difference made when this was fixed. RM UtilEyes allows you to look at data cumulatively, this school saved £25 per day amounting to over £9,000 a year on their water bill.


Quick Tour
E N D
Presentation Transcript
You can compare usage on different dates. This shows a leak identified in January 2007 and the difference made when this was fixed
RM UtilEyes allows you to look at data cumulatively, this school saved £25 per day amounting to over £9,000 a year on their water bill.
This school noticed a peak in gas usage over night, they found that the boiler was coming on just after midnight and saw significant savings when they changed this time.
In this example, the school water use looks normal. However, the base use is higher than expected outside of school hours and savings were made when the culprit was identified.