Download
1 / 30
300 likes | 410 Vues
This report analyses China's oil imports against the backdrop of the global oil and tanker market as of October 20, 2005. Key topics include the development of the tanker fleet, particularly the phase-out of single-hull tankers, as well as trends in tanker demand, main tanker trades, and freight rate developments. The study discusses the supply-demand dynamics, offering a comprehensive overview from 1996 to 2004, highlighting the increasing demand in China and the implications for the tanker market. Forecasts and potential market prospects are also covered.

E N D
China Logistics 20 October 2005 Erik.Ranheim@INTERTANKO.com Manager Research and Projects Oil Import to China – In the light of the general Oil & Tanker market
Oil Import to China seen in the Light of General oil & Tanker Markets • Tanker Fleet Development& the Phase out of Single Hull Tankers • The development of Tanker Demand& the Main Tanker Trades • Freight Rate Development • Tanker Market Prospects
Trade development 1996-2004 Ship supply has caught up % Source: Clarkson Research
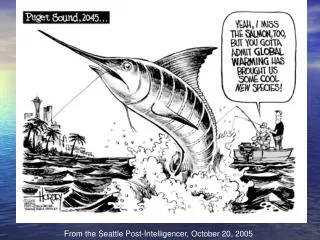
China and the Global picture Litre per capita per day
China Crude & product net imports 1999-2006 mbd Source: IEA
China Crude & product net imports 1999-2006 mbd Source: IEA/BP
Tanker trade development 1972-2006 Billion tonne-mile transported Source: Fearnleys/INTERTANKO
Seaborne oil trade- crude oil plus products1970-2004 Bn tonne miles mbd Source: Fearnleys/BP
Tanker trade development 2000-2005 Liftings to China m tonnes 39% 34% 36% 59% 63% 60% Source: Fearnleys/INTERTANKO
VLCC fixtures Total no East 103 no Source: Clarkson
Oil consumption and refinery capacity World China mbd mbd
Sales for decommissioning tanker and combined carriers No 19 m dwt m dwt 4.1 m dwt 10 months
Tanker fleet development m dwt number
Tanker fleet development m dwt number
Phase out SH tankers VLCCs470 units – 170 SH/DB/DS - 97 on order No Phase outyear
Phase out SH tankers Suezmaxes325 units - 73 SH/DB/DS – 65 on order No Phase outyear
Phase out SH tankers Aframaxes650 units – 180 SH/DB/DS – 160 on order No Phase outyear
Phase out SH tankers Panamaxes270 units – SH/DB/DS 96 – 110 deliveries No Phase outyear
Tanker fleet development m dwt
Tanker newbuilding prices m dwt number
Breaken even rate and priceBreak even normal level in a perfect market $ per day • * 8% required rate of return • * Operating costs $7,00 per day 2% increase annually. • * $ 1m, 2m, 3m, 4m ESP costs • $10 m residual value • Average rate • Ras Tanura Y’hama/price • 1999 13,397 $68.3 • 2000 54,497 $72.0 • 2001 32,852 $74.8 • 2002 19,655 $65.7 • 2003 41,558 $65.4 • 2004 91,872 $90.8 • 2005 41,290 $119.2 $ 43,300 $ 42,420 $ 36,560 $ 30,670 $ m
Middle East oil production and VLCC freight rates AG-East mbd $ per day
Freight market $ per day Cycles/Wilde cards • Cyclical, • Traditionally driven by supply side- overordering • Since 2001 disruptions and tight supply oil supply • Hurricans • Strikes (Venezuela) • Political unrest, Iraq, Nigeria’ • Congestion (Bosporous) • Phase out (also political?)
Conclusion • Supply increase of 6-7% • Watch world economy – oil demand • Cyclical - abnormal with three high peaks in a row .., but • Great uncertainty, dramatic things may happen - therefore keep your options open