Chapter 5 Inventory Control Subject to Uncertain Demand
380 likes | 1.07k Vues
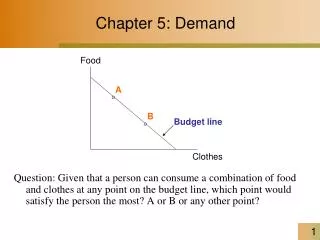
Chapter 5 Inventory Control Subject to Uncertain Demand. Timing Decisions. Quantity decisions made together with decision When to order? One of the major decisions in management of the inventory systems. Impacts: inventory levels, inventory costs, level of service provided Models:

Chapter 5 Inventory Control Subject to Uncertain Demand
E N D
Presentation Transcript
Timing Decisions Quantity decisions made together with decision When to order? One of the major decisions in management of the inventory systems. Impacts: inventory levels, inventory costs, level of service provided Models: • One time decisions • Continuous review systems • Periodic review systems
One-Time Decisions Continuous Decisions Intermittent-Time Decisions Continuous Review System Periodic Review Systems EOQ, EPQ EOQ (S, T) System (Q, R) System (s, S) System Base Stock Optional Replenishment Two Bins Timing Decisions Structure of timing decisions
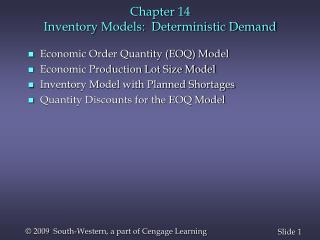
“newsboy” model or “Christmas tree” model One-Time Decision Situation is common to retail and manufacturing environment Consider seasonal goods, which are in demand during short period only. Product losses its value at the end of the season. The lead time can be longer than the selling season if demand is higher than the original order, can not rush order for additional products. Example newspaper stand Christmas ornament retailer Christmas tree finished good inventory Trivial problem if demand is known (deterministic case), in practical situations demand is described as random variable (stochastic case).
Example: One-Time Decision Mrs. Kandell has been in the Christmas tree business for years. She keeps track of sales volume each year and has made a table of the demand for the Christmas trees and its probability (frequency histogram). Solution: Q – order quantity; Q* - optimal D – demand: random variable with probability density function f(D) F(D) – cumulative probability function: F(D) = Pr (demand ≤D) co – cost per unit of positive inventory cu – cost per unit of unsatisfied demand Economics marginal analysis: overage and underage costs are balanced
Example: One-Time Decision (cont) Shortages = lost profit + lost of goodwill Overage = unit cost + cost of disposal of the overage Either ignore the purchase cost, because it does not impact the optimal solution or implicitly consider it in the overage and underage costs. Expected overage cost of the order Q* is F(Q*)co Expected shortage cost is (1-F(Q*)) cu For order Q* those two costs are equal: F(Q*)co= (1-F(Q*))cu So, - probability of satisfying demand during the period, also is known as critical ratio To calculate Q* we must use cumulative probability distribution.
Example: One-Time Decision (cont.) Mrs. Kandell estimates that if she buys more trees than she can sell, it costs about $40 for the tree and its disposal. If demand is higher than the number of trees she orders, she looses a profit of $40 per tree.
The Nature of Uncertainty Suppose that we represent demand as D = Ddeterministic + Drandom If the random component is small compared to the deterministic component, the models used in chapter 4 will be accurate. If not, randomness must be explicitly accounted for in the model. In chapter 5, assume that demand is a random variable with cumulative probability distribution F(D) and probability density function f(D). D - continuous random variable, N(μ, σ) • estimated from history of demand • seems to model many demands accurately • Objective: minimize the expected costs – law of large numbers
The Newsboy Model The critical ration can also be derived mathematically. At the start of each day, a newsboy must decide on the number of papers to purchase. Daily sales cannot be predicted exactly, and are represented by the random variable D with normal distribution N(μ, σ), where μ = 11.73 and σ = 4.74 It can be shown that the optimal number of papers to purchase is the fractile of the demand distribution given by F(Q*) = cu / (cu + co). See Figure 5-4 when demand is normal with μ = 11.73 and σ = 4.74, and the critical fractile is 0.77.
Determination of the Optimal Order Quantity for Newsboy Example
Lot Size Reorder Point Systems (Q, R) Assumptions • Inventory levels are reviewed continuously (the level of on-hand inventory is known at all times) • Demand is random but the mean and variance of demand are constant (stationary demand) • There is a positive lead time, τ. • The costs are: • Set-up each time an order is placed at $K per order • Unit order cost at $c for each unit ordered • Holding at $h per unit held per unit time ( i.e. per year) • Penalty cost of $p per unit of unsatisfied demand
Decision Variables For EOQ model there was a single decision variable Q. The value of the reorder level, R, was determined by Q: Q= λT R = λτ, if τ < T R = λ*MOD(τ/T), if τ > T In the stochastic demand case, we treat Q and R as independent decision variables R is chosen to protect against uncertainty of demand during the lead time Q is chosen to balance the holding and set-up costs
Changes in Inventory Over Time for Continuous-Review (Q, R) System Order Q whenever inventory is at level R
The Cost Function The average annual cost is given by: Interpret n(R) as the expected number of stockouts per cycle calculated using the standardized loss function L(z): n(R)=σL((R-μ)/σ) The standardized loss integral values appear in Table A-4. The optimal values of (Q,R) that minimizes G(Q,R) can be found by iterating between equations: Initiate Q0=EOQR0n(R)Q1R1…
Service Levels in (Q,R) Systems In many circumstances, the penalty cost, p, is difficult to estimate. For this reason, it is common business practice to set inventory levels to meet a specified service objective instead. The two most common service objectives are: • Type 1 service: Choose R so that the probability of not stocking out in the lead time is equal to a specified value. • Type 2 service. Choose both Q and R so that the proportion of demands satisfied from stock equals a specified value.
Computations For type 1 service, if the desired service level is α then one finds R from F(R)= α and sets Q=EOQ Type 2 service requires a complex iterative solution procedure to find the best Q and R. See Example 5.5 on page 256. Type 1 finds fraction of periods in which there is no stock-out (no matter one item short or 1000). Type 2 measures the percentage of all filled orders in all periods (95% or 98% service objective).
Comparison of Type 1 and Type 2 Services Order Cycle Demand Stock-Outs 1 180 0 2 75 0 3 235 45 4 140 0 5 180 0 6 200 10 7 150 0 8 90 0 9 160 0 10 40 0 For a type 1 service objective there are two cycles out of ten in which a stock-out occurs, so the type 1 service level is 80%. For type 2 service, there are a total of 1,450 units demand and 55 stockouts (which means that 1,395 demand are satisfied). This translates to a 96% fill rate.
Other Continues Review System: Order-Up-To-Level (R, S) System
Periodic Review System: Order-Up-To-Level (s, S) vs (s, Q) System
(s, S) Policies The (Q,R) policy is appropriate when inventory levels are reviewed continuously. In the case of periodic review, a slight alteration of this policy is required. Define two levels, s < S, and let u be the starting inventory at the beginning of a period. Then In general, computing the optimal values of s and S is much more difficult than computing Q and R.
Homework Assignment • Read Ch. 5 (5.1 – 5.8) • 5.3, 5.6 – 5.8, 5.12, 5.15, 5.19, 5.25 – 5.27